IMAGE

Figure 4

ID
ZDB-IMAGE-221018-162
Source
Figures for Schipper et al., 2022
Image
Figure Caption

Figure 4

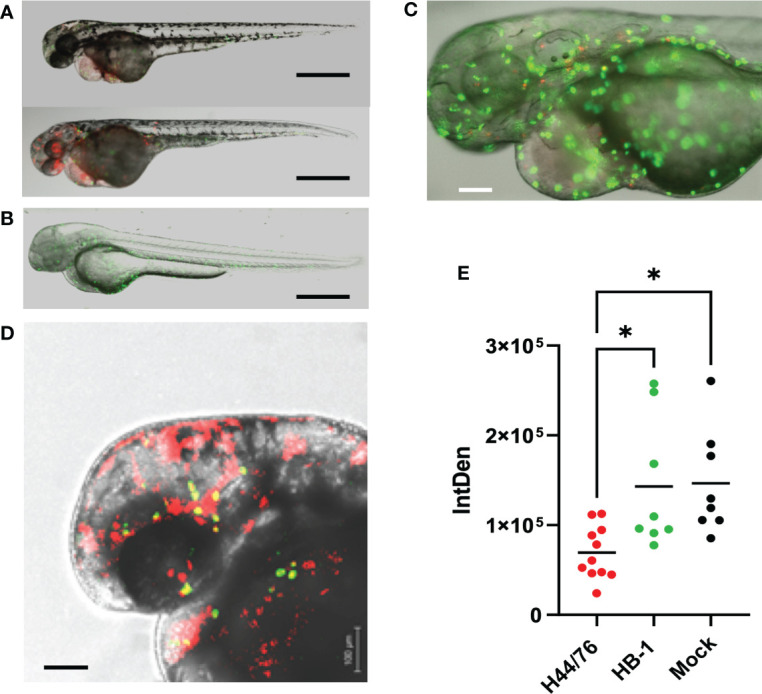
Fluorescence microscopy of H44/76 meningococci expressing mCherry (red fluorescence) and neutrophils expressing GFP (green fluorescence) in zebrafish embryos. (A). H44/76 infected embryos at 24 hpi, Bar represents 100 μm. (B). HB-1 infected embryo at 24 hpi. (C). Detail of H44/76 infected embryo showing green fluorescent neutrophils and red fluorescent meningococci. (D) Detail of H44/76 infected embryo showing green fluorescent neutrophils and red fluorescent meningococci in the embryo head. Yellow color shows overlap between meningococci and neutrophils.Scale bars represent 100 μm. (E) Number of neutrophils in zebrafish embryos 24hpi of N. meningitidis H44/76 serogroup B (1400 cfu) or non-encapsulated HB-1 (1600 cfu) and mock-infected; 11 embryos infected with H44/76, two groups of 8 embryos infected with HB-1 or mock infected, respectively. IntDen = Integrated density of the green fluorescence signal in the area of interest. * P = < 0.05.

Acknowledgments
This image is the copyrighted work of the attributed author or publisher, and ZFIN has permission only to display this image to its users. Additional permissions should be obtained from the applicable author or publisher of the image. Full text @ Front Cell Infect Microbiol