
- Title
-
Preclinical Evaluation of Novel Tyrosine-Kinase Inhibitors in Medullary Thyroid Cancer
- Authors
- Saronni, D., Gaudenzi, G., Dicitore, A., Carra, S., Cantone, M.C., Borghi, M.O., Barbieri, A., Mignani, L., Hofland, L.J., Persani, L., Vitale, G.
- Source
- Full text @ Cancers

Representative results of FGFR-1 (192 bp), FGFR-2 (144 bp), FGFR-3 (181 bp), FGFR-4 (94 bp), FGF-2 (83 bp) and FGF-8 (82 bp) mRNA expression in TT and MZ-CRC-1 cells (MZ). Water was used as negative control (C). |

Dose-dependent effect of SU5402, sulfatinib and SPP86 on cell viability of TT (a) and MZ-CRC-1 (b) cell lines, as measured by the MTT assay. Cells were incubated for 6 days with vehicle (control) or with the drug at different concentrations, as described in Material and Methods. Dose response curves were expressed as nonlinear regression (curve fit) of log (concentration drug) versus the percentage of control. Values represent the mean and standard error of the mean of at least three independent experiments in six replicates. **: p < 0.01, ***: p < 0.001, CTR: control, MTT: 3-(4,5-dymethylthiazol-2-yl)-2,5-diphenyltetrazolium bromide. |
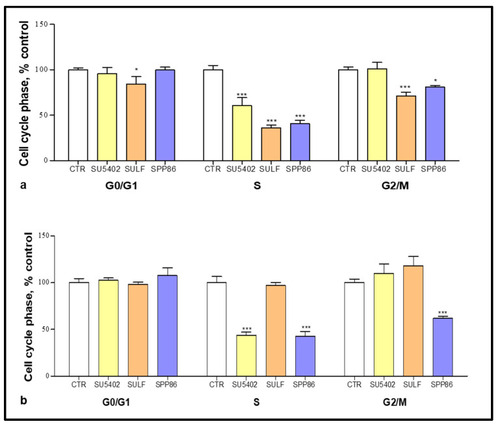
Cell cycle analysis after 6 days of incubation with SU5402, sulfatinib (SULF) and SPP86 in TT (a) and MZ-CRC-1 (b) cell lines. Cells were detected by FACS analysis after staining with propidium iodide. CTR values have been set to 100%. Values represent the mean ± standard error of the mean of at least 3 independent experiments. *: p < 0.05, ***: p < 0.001, CTR: control, SULF: sulfatinib. |
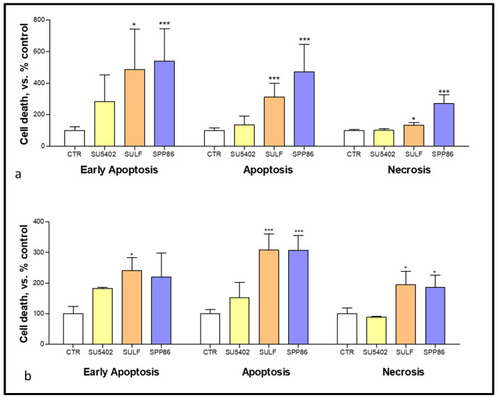
Modulation of cell death analysis after 6 days of incubation with SU5402, SULF and SPP86 in TT (a) and MZ-CRC-1 (b) cell lines through flow cytometry with annexin V and propidium iodide. The proportions of cells in early apoptosis, late apoptosis and necrosis are expressed as percentage compared with CTR and represent the mean ± standard error of the mean of at least 3 independent experiments. *: p < 0.05, ***: p < 0.001, CTR: control, SULF: sulfatinib. |
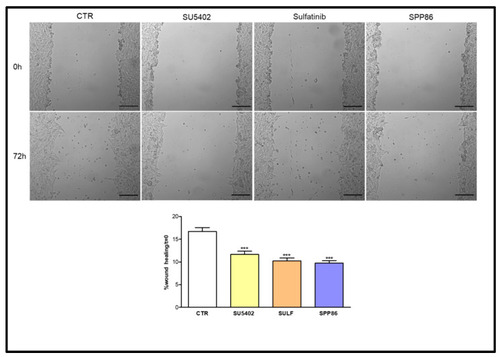
Effect of SU5402, SULF and SPP86 on TT cell migration compared to vehicle treated CTR. The area of wound was recorded at 0 and 3 days, and the percentage of wound healing with respect to T0 was calculated using the equation reported in Material and Methods section. Data are reported as mean ± standard error of the mean of at least 3 independent experiments. Scale bar 200 μm. ***: p < 0.001, CTR: control, SULF: sulfatinib. |
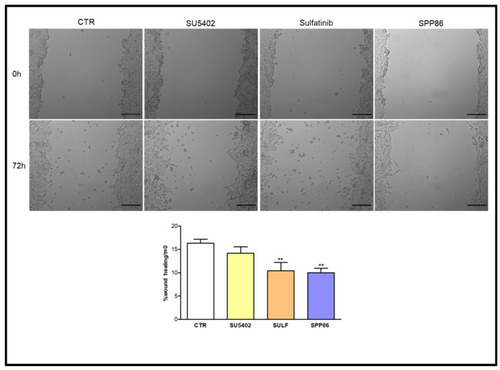
Effect of SU5402, SULF and SPP86 on MZ-CRC-1 cell migration compared to vehicle treated CTR. The area of wound was recorded at 0 and 3 days, and the percentage of wound healing with respect to T0 was calculated using the equation reported in the Material and Methods section. Data were reported as mean ± standard error of the mean of at least 3 independent experiments. Scale bar 200 μm. **: p < 0.01, CTR: control, SULF: sulfatinib. |
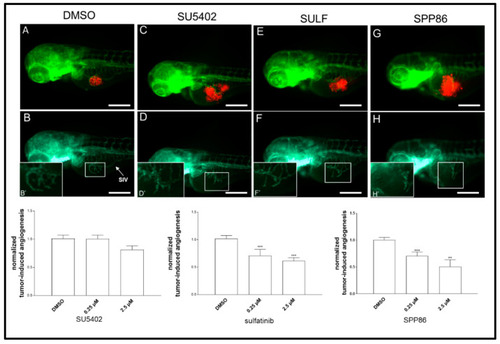
Effects of SU5402, sulfatinib and SPP86 on TT cell-induced angiogenesis in zebrafish. There is a representative image of an injected and treated embryo for each inhibitor (2.5 µM) and control (vehicle DMSO) in panels (A,C,E,G). The red fluorescence channel, corresponding to red stained TT cells, was omitted in panels (B,D,F,H) to highlight the tumor-induced microvascular network sprouting from the SIV (sub-intestinal vein) plexus (white arrow). Digital magnifications of the graft region are shown in white-boxed regions (B’,D’,F’,H’). Graphs below report the results of tumor-induced angiogenesis quantification at 24 h post-injection. All images are oriented so that rostral is to the left and dorsal is at the top. Scale bar: 100 µm. **: p < 0.01, ***: p < 0.001. |