
Image
|
Figure Caption
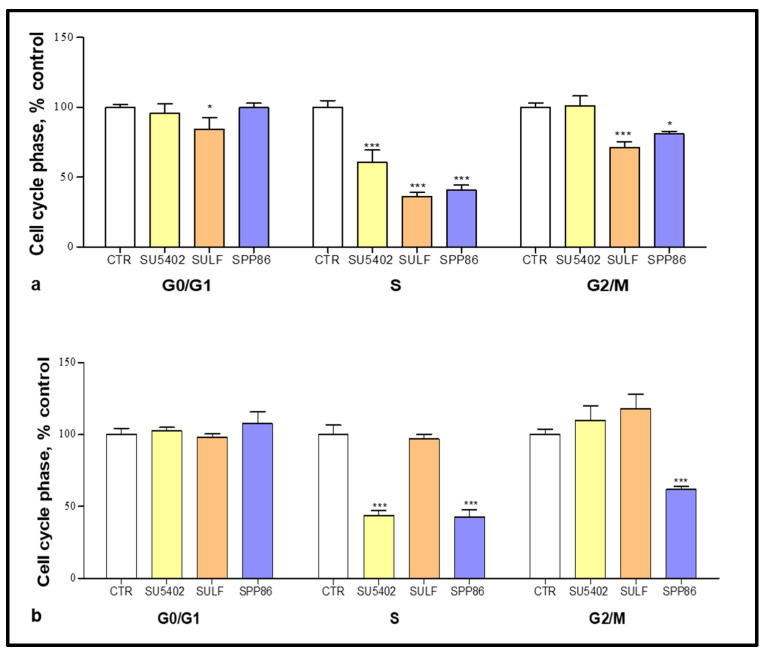
Fig. 3
Cell cycle analysis after 6 days of incubation with SU5402, sulfatinib (SULF) and SPP86 in TT (a) and MZ-CRC-1 (b) cell lines. Cells were detected by FACS analysis after staining with propidium iodide. CTR values have been set to 100%. Values represent the mean ± standard error of the mean of at least 3 independent experiments. *: p < 0.05, ***: p < 0.001, CTR: control, SULF: sulfatinib.
Acknowledgments
This image is the copyrighted work of the attributed author or publisher, and
ZFIN has permission only to display this image to its users.
Additional permissions should be obtained from the applicable author or publisher of the image.
Full text @ Cancers