
|
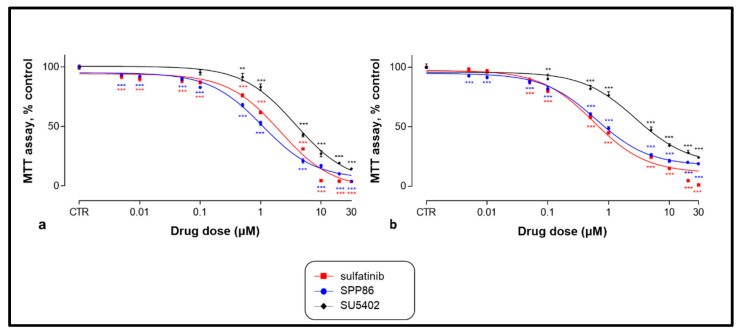
Fig. 2
Dose-dependent effect of SU5402, sulfatinib and SPP86 on cell viability of TT (a) and MZ-CRC-1 (b) cell lines, as measured by the MTT assay. Cells were incubated for 6 days with vehicle (control) or with the drug at different concentrations, as described in Material and Methods. Dose response curves were expressed as nonlinear regression (curve fit) of log (concentration drug) versus the percentage of control. Values represent the mean and standard error of the mean of at least three independent experiments in six replicates. **: p < 0.01, ***: p < 0.001, CTR: control, MTT: 3-(4,5-dymethylthiazol-2-yl)-2,5-diphenyltetrazolium bromide.