
|
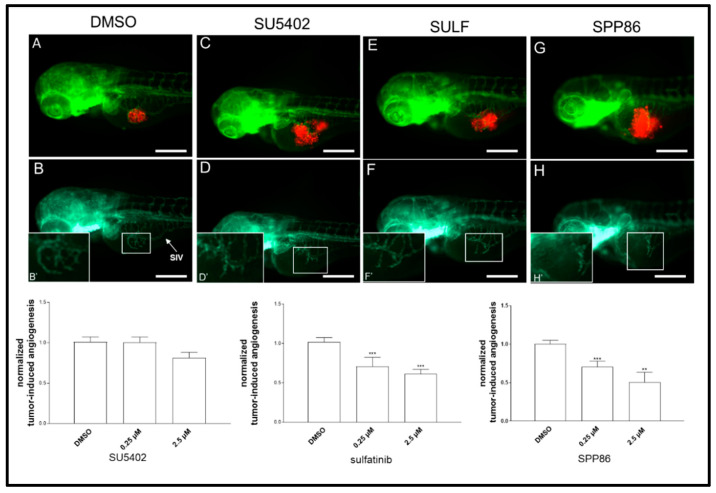
Fig. 7
Effects of SU5402, sulfatinib and SPP86 on TT cell-induced angiogenesis in zebrafish. There is a representative image of an injected and treated embryo for each inhibitor (2.5 µM) and control (vehicle DMSO) in panels (A,C,E,G). The red fluorescence channel, corresponding to red stained TT cells, was omitted in panels (B,D,F,H) to highlight the tumor-induced microvascular network sprouting from the SIV (sub-intestinal vein) plexus (white arrow). Digital magnifications of the graft region are shown in white-boxed regions (B’,D’,F’,H’). Graphs below report the results of tumor-induced angiogenesis quantification at 24 h post-injection. All images are oriented so that rostral is to the left and dorsal is at the top. Scale bar: 100 µm. **: p < 0.01, ***: p < 0.001.