
- Title
-
Role of the melanocortin system in zebrafish skin physiology
- Authors
- Leal, E., Angotzi, A.R., Gregório, S.F., Ortiz-Delgado, J.B., Rotllant, J., Fuentes, J., Tafalla, C., Cerdá-Reverter, J.M.
- Source
- Full text @ Fish Shellfish Immunol.

Fig. 1. Skin morphology. Histological sections stained with haematoxylin-eosin (B,D,F,H) and haematoxylin-VOF (A,C,E,G) showing dorsal and ventral skin morphology in WT and ASIP1 genotypes WT dorsal skin (A, B), WT ventral skin (C, D), ASIP1 dorsal skin (E, F) and ASIP1 ventral skin (G, H). Scale bar is 100 μm. |
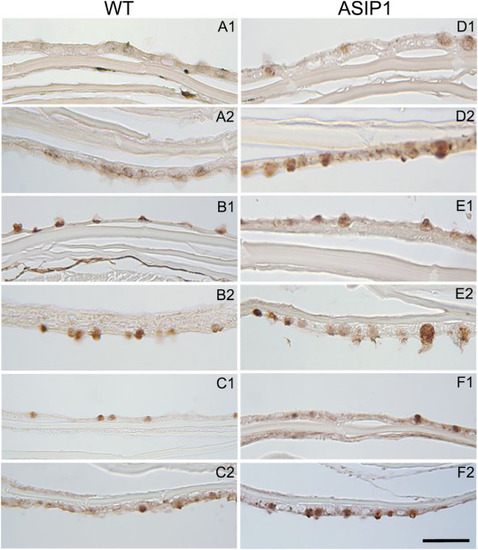
Fig. 2. Presence of lectins in skin. Histological sections showing glucidic residues bound to glycoconjugates in wild type (WT) and ASIP1-overexpressing transgenic zebrafish. The following horseradish peroxidase (HRP) conjugated lectins were used: Canavalia ensiformes/ConA (mannose and/or glucose), Triticum vulgaris/WGA (N-acetyl-d-glucosamine, Ulexeuropeus/UEA-I (l-Fucose), Sambucusnigra/SNA (NeuNAc/sialic acid/NANA) and Glycine max/SBA (α-N-acetyl-d-galactosamine). A) WT/SBA, B) WT/WGA, C) WT/SNA, D) ASIP1/SBA, E) ASIP1/WGA and F) ASIP1/SNA. (1) and (2) indicate dorsal and ventral respectively. Scale bar is 100 μm. |

Fig. 3. Total protein concentration in skin mucus of wildtype and ASIP1 zebrafish kept under undisturbed basal conditions. The total protein concentration in mucus using a BCA protein assay. Each bar represents mean ± SEM (n = 25). Data were analyzed with two-tailed Student's t-test and differences considered significant when p < 0.05. |

Fig. 4. Total protein concentration in skin mucus after stress exposure. Skin mucus was collected (n = 18 each genotype) and total protein concentration quantified as before. … Data were analyzed with a two-way ANOVA test and differences were considered significant when p < 0.05. |

Fig. 5. Effects of stress on body weight of WT and ASIP1 zebrafish. Each bar represents the mean of weight loss ± SEM (n = 72). Statistical analysis was carried out using the two-tailed Student's-test and the difference was considered significant when P < 0.005. |
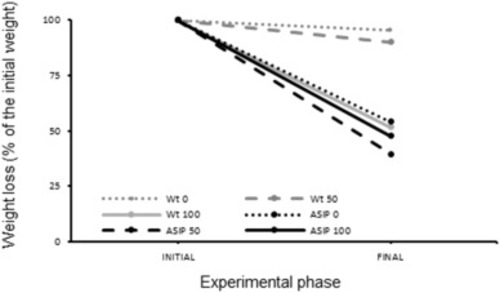
Fig. 6. Percentage of weight loss after the challenge with lipopolysaccharide (LPS) . Each line represents the percentage of loss of the initial body weight after LPS exposition (0, 50 and 100 μg/ml) during 4 days in wild type (Wt) and ASIP1 animals at the end (final) of the experiment (9 animals per group). |
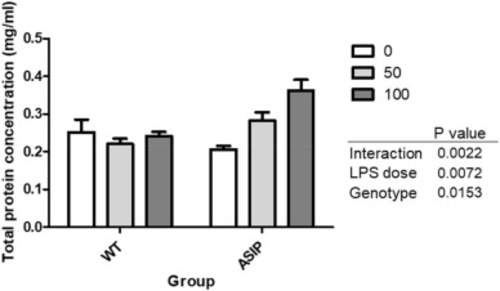
Fig. 7. Total protein concentration in skin mucus after LPS challenge. White and grey bars indicate protein mucus levels at the beginning (initial) and end (final) of the experiment. Each bar represents the mean ± SEM (n = 7). Data were analyzed with a two-way ANOVA test and differences were considered significant when p < 0.05.. |

Fig. 8. Damage due to LPS challenge. Representative pictures showing skin damages after LPS exposition (100 μg/ml) for 5 h in wild type (WT) and ASIP1 fish. After LPS treatment fish were transferred to untreated water and 24 h later the pictures were taken focusing the ventral skin. . Scale bar is 1 cm. |
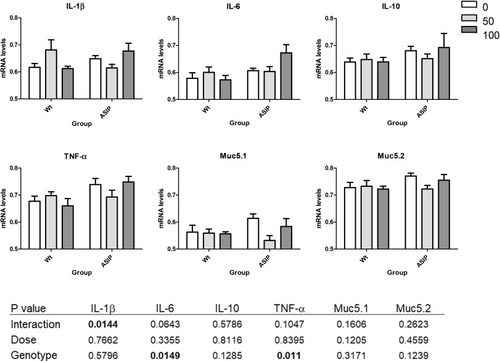
Fig. 9. Transcriptional levels of cytokines and mucins after exposure to different doses of LPS. Zebrafish (WT and ASIP1) were exposed to a challenge bath with different doses of LPS (0, 50 or 100 μg/ml). After four days, five zebrafish from each group were sacrificed and skin samples were taken for RNA extraction to determine the levels of expression of some pro-inflammatory cytokines and two mucins using real-time PCR. Data are shown as mean gene expression relative to endogenous control β-actin expression mean ± SEM (n = 5). Data were analyzed with a two-way ANOVA test and the differences were considered significant when p < 0.05. |

Fig. 10. Transcriptional levels of cytokines and mucins following exposure to LPS. In a subsequent experiment to that shown in Fig. 9, zebrafish (WT and ASIP1) were exposed to a challenge bath with 100 μg/ml of LPS during 4 h. Animals were then transferred to fresh water and skin samples (n = 10) were taken after 1 and four days, t for RNA extraction to determine the levels of expression of some pro-inflammatory cytokines and two mucins by real-time PCR. Data are shown as mean gene expression relative to endogenous control β-actin expression mean ± SEM (n = 10). Data were analyzed with a two-way ANOVA test. The differences were considered significant when p < 0.05. |
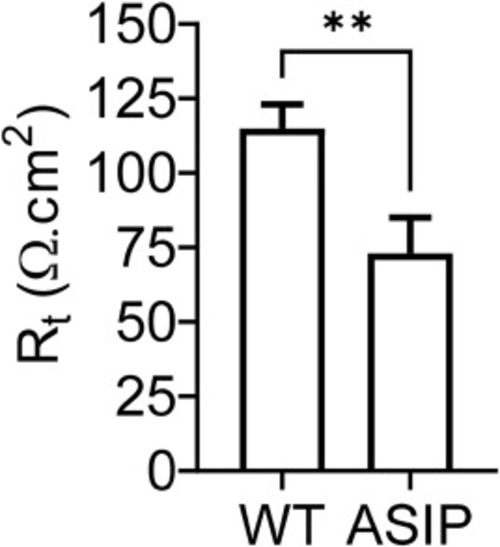
Fig. 11. Trans-epithelial electrical resistance (Rt, Ω cm2) in zebrafish skin recorded in vitro. Each column represents the mean ± SEM of 11 determinations in the wild type (WT) and 9 ASIP zebrafish. Asterisks represent significant effects (p < 0.001) after Student's t-test. |