
Image
|
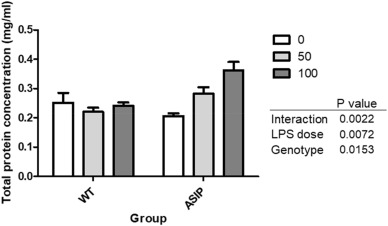
Figure Caption
Fig. 7 Fig. 7. Total protein concentration in skin mucus after LPS challenge. White and grey bars indicate protein mucus levels at the beginning (initial) and end (final) of the experiment. Each bar represents the mean ± SEM (n = 7). Data were analyzed with a two-way ANOVA test and differences were considered significant when p < 0.05..
Acknowledgments
This image is the copyrighted work of the attributed author or publisher, and
ZFIN has permission only to display this image to its users.
Additional permissions should be obtained from the applicable author or publisher of the image.
Full text @ Fish Shellfish Immunol.