
FIGURE
Fig. 11
Fig. 11
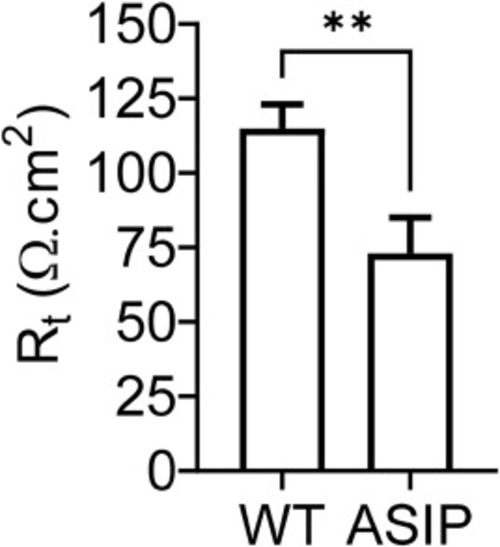
Fig. 11. Trans-epithelial electrical resistance (Rt, Ω cm2) in zebrafish skin recorded in vitro. Each column represents the mean ± SEM of 11 determinations in the wild type (WT) and 9 ASIP zebrafish. Asterisks represent significant effects (p < 0.001) after Student's t-test. |
Expression Data
Expression Detail
Antibody Labeling
Phenotype Data
Phenotype Detail
Acknowledgments
This image is the copyrighted work of the attributed author or publisher, and
ZFIN has permission only to display this image to its users.
Additional permissions should be obtained from the applicable author or publisher of the image.
Full text @ Fish Shellfish Immunol.