
Fig. 9
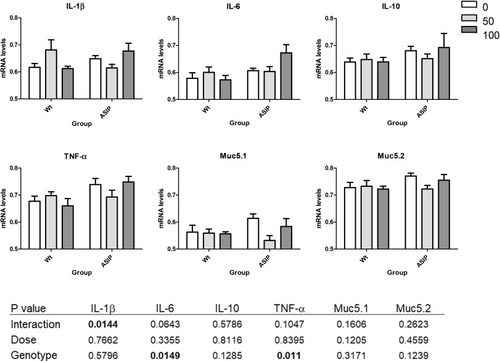
Fig. 9. Transcriptional levels of cytokines and mucins after exposure to different doses of LPS. Zebrafish (WT and ASIP1) were exposed to a challenge bath with different doses of LPS (0, 50 or 100 μg/ml). After four days, five zebrafish from each group were sacrificed and skin samples were taken for RNA extraction to determine the levels of expression of some pro-inflammatory cytokines and two mucins using real-time PCR. Data are shown as mean gene expression relative to endogenous control β-actin expression mean ± SEM (n = 5). Data were analyzed with a two-way ANOVA test and the differences were considered significant when p < 0.05. |