
- Title
-
Chronic neurotransmission increases the susceptibility of lateral-line hair cells to ototoxic insults
- Authors
- Lukasz, D., Beirl, A., Kindt, K.
- Source
- Full text @ Elife
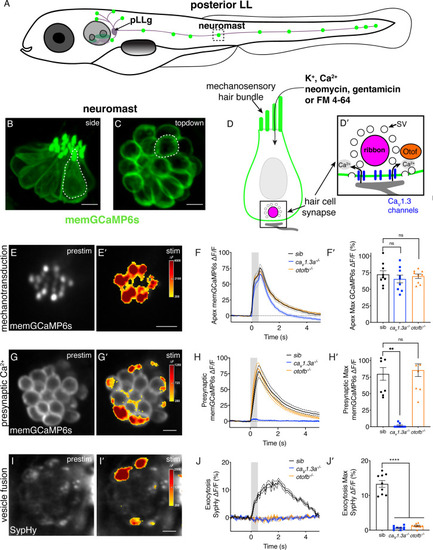
Genetic basis of neurotransmission in the zebrafish posterior-lateral line. (A) Cartoon drawing of 5 dpf zebrafish larva with the posterior lateral line (LL) highlighted. The LL is made up of clusters of hair cell clusters called neuromasts (green dots). Neuromasts are innervated by neurons that project from the posterior LL ganglion (pLLg). (B–C) Side view (B) and top-down view (C) of neuromast from Tg[myo6b:memGCaMP6s]idc1 fish where the hair-cell membrane is labeled. White dotted line demarcates a single hair cell in each image. (D-D’) Cartoon schematic of a side view of a hair cell. At the apex is the mechanosensory hair bundle. The primary pathway of entry of neomycin, gentamicin, and FM 4–64 is through mechanotransduction channels in the mechanosensory hair bundle. At the base of the hair cell is the ribbon synapse. The presynapse or ribbon (magenta) is surrounded by synaptic vesicles (SV, white circles). When mechanotransduction channels are activated, an influx of cations including calcium enters the hair bundle. Hair bundle activation leads to opening of Cav1.3 voltage-gated calcium channels (blue) and presynaptic calcium influx. The calcium sensor Otoferlin (orange) facilitates fusion by coupling calcium influx with the exocytosis of SVs and the release of glutamate onto the innervating postsynaptic afferent terminal (gray). (E-E’) The spatial patterns of the evoked calcium influx (GCaMP6s ΔF, indicated via the heatmaps) into sibling hair bundles (E’) compared to prestimulus (C). (F-F’) Average traces (F) and dot plots show that the average magnitude of apical (F’) ΔF/F GCaMP6s signals in mechanosensory hair bundles is not different in cav1.3a-/- and otofb-/- mutants compared to siblings. (G-G’) The spatial patterns of the evoked calcium influx (GCaMP6s ΔF, indicated via the heatmaps) at wildtype presynapses (G’) compared to prestimulus (G). (H-H’) Average traces (H) and dot plots show that the average magnitude of presynaptic (H’) ΔF/F GCaMP6s signals is absent in cav1.3a-/- but unaltered in otofb-/- mutants compared to siblings. (I-I’) The spatial patterns of evoked exocytosis (SypHy ΔF, indicated via the heatmaps) at sibling presynapses (I’) compared to prestimulus (I). (J-J’) Averaged traces (J) and dot plots show that presynaptic (J’) ΔF/F SypHy signals are absent in cav1.3a-/- and in otofb-/- mutants. The fluid-jet stimulus depicted as a gray box in F, H, and J. Each point in the dot plots represents one neuromast. All measurements were performed in mature neuromasts at 5–6 dpf on 3 animals and 9 neuromasts per genotype. Error bars: SEM. A one-way AVOVA with a Dunnett’s correction for multiple tests was used in F’ and J’, and a Kruskal-Wallis test with a Dunn’s correction for multiple tests was used in H’. ** p<0.01, **** p<0.0001. Scale bar = 5 µm.
|
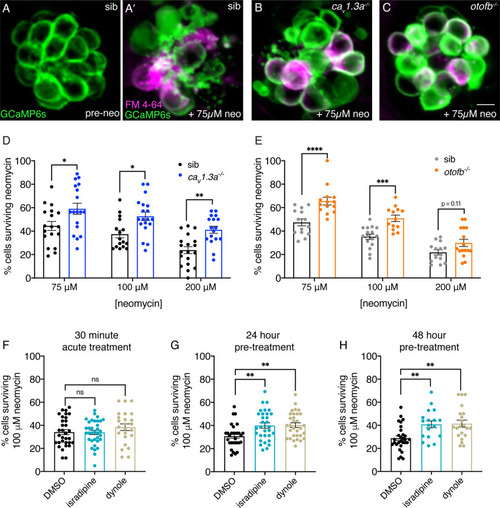
Chronic loss of neurotransmission protects hair cells from the ototoxin neomycin. (A-A’) Hair cells in siblings before (A) and after a 30-min treatment with 75 µM neomycin (A’). GCaMP6s outlines hair cells. The presence of FM 4–64 in hair cells reveals surviving cells (A’). (B-C’) After a 30-min treatment with 75 µM neomycin GCaMP6s and FM 4–64 more surviving hair cells are found in cav1.3a-/- (B), and otofb-/- (C) mutants. (D–E) A higher percentage of CaV1.3- and Otof-deficient hair cells survive a 30 min treatment with three different neomycin concentrations (75, 100, and 200 µM) compared to sibling controls. For quantification in D-E, neuromasts were examined at 5 or 6 dpf immediately after washout of neomycin solution and application of FM 4–64. (F) Percentage of hair cells per neuromast surviving is not altered when hair cells in wildtype larvae are co-incubated with 0.1% DMSO (control), 10 µM isradipine, or 2.5 µM Dynole 34–2 during the 30-min 100 µM neomycin treatment. (G–H) When wildtype hair cells are incubated with 10 µM isradipine or 2.5 µM Dynole 34–2 for 24 hr (G, 4 to 5 dpf) or for 48 hr (H, 3 to 5 dpf) prior to neomycin treatment significantly more hair cells survive compared to DMSO controls. Each point in the dot plots in D-H represents one neuromast. A minimum of five animals were examined per treatment group. Error bars: SEM. For comparisons, a two-way ANOVA with a Sidak’s correction for multiple comparisons was used in D-E. A one-way AVOVA with a Dunnett’s correction for multiple comparisons was used in F, G and H. * p<0.05, ** p<0.01, *** p<0.001. Scale bar = 5 µm.
|
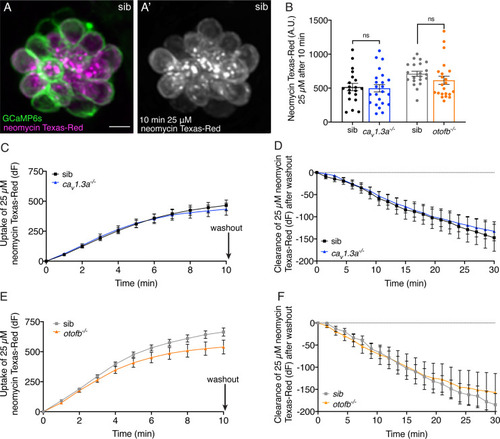
Cav1.3a and otofb mutant hair cells have normal neomycin uptake and retention. (A-A’) Example of hair cells in a wildtype neuromast after incubation in 25 µM neomycin-Texas Red solution (Neo-TR) for 10 min. GCaMP6s outlines hair cells in A. (B) Average dot plots of Neo-TR fluorescence intensity in neuromasts from cav1.3a-/- (blue) and otofb-/- (orange) mutants and siblings (black and grey, respectively) after a 10-min incubation in 25 µM Neo-TR. No differences in overall neomycin uptake are seen between mutants and siblings. (C–E) Average Neo-TR fluorescence intensity over the course of 10 min 25 µM exposure in cav1.3a-/- mutant neuromasts (blue) and siblings (black) (C) and otofb-/- mutant neuromasts (orange) and siblings (grey) (E). No differences are seen between mutants and siblings in the time course of neomycin uptake. (D–F) Average Neo-TR fluorescence intensity over the course of 30 min following Neo-TR washout in cav1.3a-/- mutant neuromasts (blue) and siblings (black) (D) and otofb-/- mutant neuromasts (orange) and siblings (grey) (F). No significant differences were detected in neomycin clearance or retention between mutants and siblings. Each point in B represents one neuromast. A minimum of 14 neuromasts are averaged for the plots in C-F. A minimum of five animals at 5 dpf were examined per treatment group. Error bars: SEM. For comparisons, unpaired t-tests were used in B, and a two-way ANOVA with a Sidak’s correction for multiple comparisons was used in C-F. Scale bar = 5 µm.
|
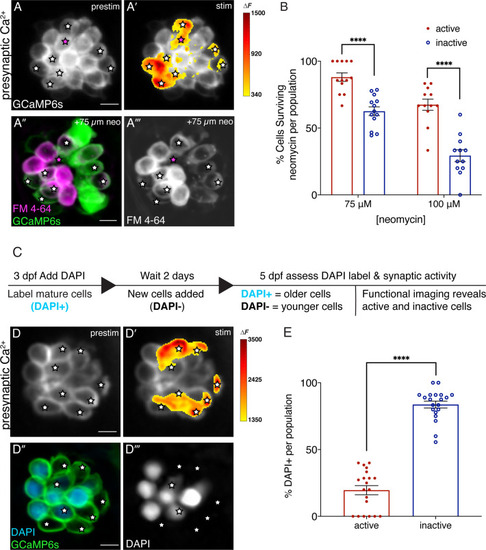
Synaptically active cells are relatively young and more resistant to neomycin. (A-A’) Hair cells from wildtype 5 dpf fish before and during a 2 s fluid-jet stimulus. The spatial patterns of the evoked calcium influx during stimulation (A’ GCaMP6s ΔF, indicated via the heatmaps) compared to prestimulus (A) reveal synaptically active cells (white stars). (A”-A’’’) Hair cells depicted in A and A’ after a 30-min treatment with 75 µM neomycin solution. Magenta star demarcates an active cell that did not survive neomycin treatment. (B) A higher percentage of active hair cells survive a 30-min treatment with two different neomycin concentrations (75 and 100 µM) compared to inactive cells. Neuromasts were examined at 5 dpf immediately after washout of neomycin solution and application of FM 4–64. (C) Outline of DAPI labeling protocol used to differentiate between older and younger cells within a given neuromast. DAPI is used to label mature hair cells at 3 dpf. At 5 dpf, the hair cells are assessed. (D-D’) Hair cells from wildtype 5 dpf fish before and during a 2 second fluid-jet stimulus. The spatial patterns of the evoked calcium influx during stimulation (D’ GCaMP6s ΔF, indicated via the heatmaps) compared to prestimulus (D) reveal synaptically active cells (white stars). (D’’-D’’’) Hair cells depicted in D and D’ showing DAPI-positive older and DAPI-negative younger cells. (E) DAPI-positive older cells make up a much greater percentage of the inactive cell population than the active cell population. A minimum of five animals were examined per experimental group at 5 dpf. Each dot in B and E represents one neuromast. Error bars: SEM. For comparisons, a two-way ANOVA with a Sidak’s correction for multiple comparisons was used in B. A Mann-Whitney test was used in E. **** p<0.0001. Scale bar = 5 µm.
|
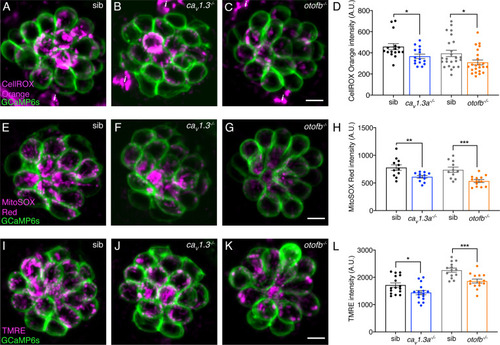
Cav1.3a and otofb mutants exhibit reduced mitochondrial oxidation and mitochondrial activity. (A–C) Hair cells in a wildtype, cav1.3a-/- or otofb-/- neuromast (labeled with GCaMP6s) after 30-min incubation with 12.5 µM CellROX. (B) Average dots plots show that CellROX Orange fluorescence intensity is lower in cav1.3a-/- (blue) and otofb-/- (orange) mutants compared to wildtype siblings (black, gray). (E–G) Hair cells in a wildtype, cav1.3a-/- or otofb-/- neuromast (labeled with GCaMP6s) after a 15-min incubation with 5 µM MitoSOX. (H) Average dots plots show that MitoSOX Red fluorescence intensity is lower in cav1.3a-/- (blue) and otofb-/- (orange) mutants compared to wildtype siblings (black, gray). (I–K) Hair cells in a wildtype, cav1.3a-/- or otofb-/- neuromast (labeled with GCaMP6s) following a 30-min incubation with 10 nM TMRE. (L) Average dots plots show that the TMRE fluorescence intensity is reduced in both cav1.3a-/- (blue) and otofb-/- (orange) mutants compared to respective siblings (black, gray). Each dot in D, H, and L represents one neuromast. A minimum of 5 animals were examined at 6 dpf per treatment group. Error bars: SEM. For comparisons, an unpaired t-test was used. i in A-C are not hair cells but ionocytes labeled by CellROX. * p<0.05, ** p<0.01, *** p<0.001. Scale bar = 5 µm.
|
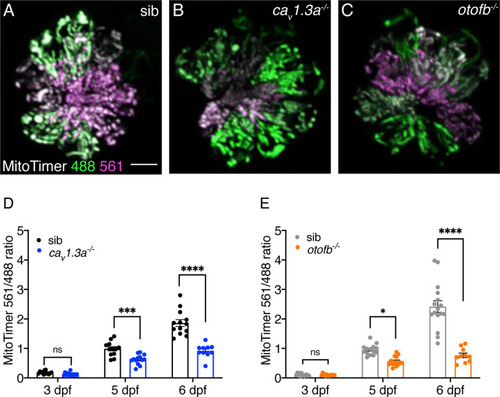
Red-shifted oxidized MitoTimer signal is reduced in cav1.3a and otofb mutants. (A–C) Hair cells in wildtype (A), cav1.3a-/- mutant (B), and otofb-/- mutant (C) Tg[myosin6b:mitoTimer]w208 neuromasts at 5 dpf. (D–E) Average dot plots of the ratio of red/green MitoTimer fluorescence intensity at 3, 5, and 6 dpf in cav1.3a-/- mutant fish (blue) (D) and otofb-/- mutant fish (orange) (E) and respective siblings (black, gray) show that mutants exhibit reduced mitochondrial oxidation over time. Each dot in D and E represents one neuromast. A minimum of 3 animals and 10 neuromasts were examined per treatment group. Error bars: SEM. For comparisons, a two-way ANOVA with a Sidak’s correction for multiple comparisons was used in D-E. * p<0.05, *** p<0.001, **** p<0.0001. Scale bar = 5 µm.
|
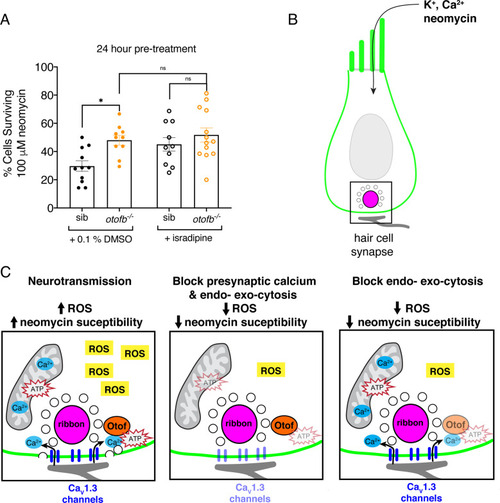
The synaptic vesicle cycle is a major contributor to hair-cell oxidative stress. (A) Average dot plots show the percentage of cells surviving neomycin treatment per neuromast. A significantly higher percentage of cells survive in otofb-/- mutants (orange) compared to siblings (black) when animals are treated with 0.1% DMSO for 24 hr from 4 to 5 dpf. No additional protection is observed in otofb-/- mutants (open orange) compared to siblings (open black) when animals are treated with 10 µM isradipine for 24 hr from 4 to 5 dpf prior to neomycin challenge. (B) Cartoon schematic of a hair cell with black box around the ribbon (magenta) synapse. (C) Close up of synapse demarcated in (B). Both presynaptic calcium influx (blue) and otoferlin (orange) function consume ATP (red stars) and stimulate ROS (yellow box) production. Blocking calcium influx inhibits both processes and reduces ROS levels. Blocking the synaptic vesicle cycle alone reduces ROS levels to a similar extent as the calcium channel block. Each dot in A represents one neuromast. A minimum of three animals were examined per treatment group. Error bars: SEM. For comparisons, a two-way ANOVA with a Sidak’s correction for multiple comparisons was used in A. * p<0.05.
|