
|
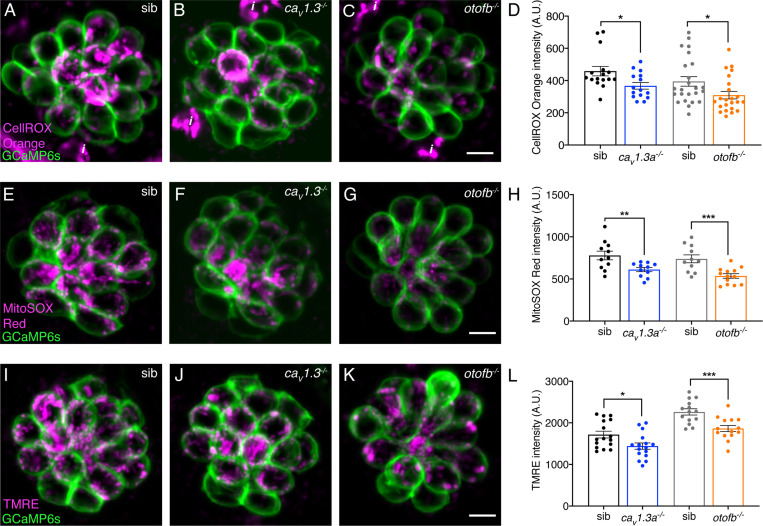
Fig. 5
(A–C) Hair cells in a wildtype, cav1.3a-/- or otofb-/- neuromast (labeled with GCaMP6s) after 30-min incubation with 12.5 µM CellROX. (B) Average dots plots show that CellROX Orange fluorescence intensity is lower in cav1.3a-/- (blue) and otofb-/- (orange) mutants compared to wildtype siblings (black, gray). (E–G) Hair cells in a wildtype, cav1.3a-/- or otofb-/- neuromast (labeled with GCaMP6s) after a 15-min incubation with 5 µM MitoSOX. (H) Average dots plots show that MitoSOX Red fluorescence intensity is lower in cav1.3a-/- (blue) and otofb-/- (orange) mutants compared to wildtype siblings (black, gray). (I–K) Hair cells in a wildtype, cav1.3a-/- or otofb-/- neuromast (labeled with GCaMP6s) following a 30-min incubation with 10 nM TMRE. (L) Average dots plots show that the TMRE fluorescence intensity is reduced in both cav1.3a-/- (blue) and otofb-/- (orange) mutants compared to respective siblings (black, gray). Each dot in D, H, and L represents one neuromast. A minimum of 5 animals were examined at 6 dpf per treatment group. Error bars: SEM. For comparisons, an unpaired t-test was used. i in A-C are not hair cells but ionocytes labeled by CellROX. * p<0.05, ** p<0.01, *** p<0.001. Scale bar = 5 µm.