
|
Fig. 3
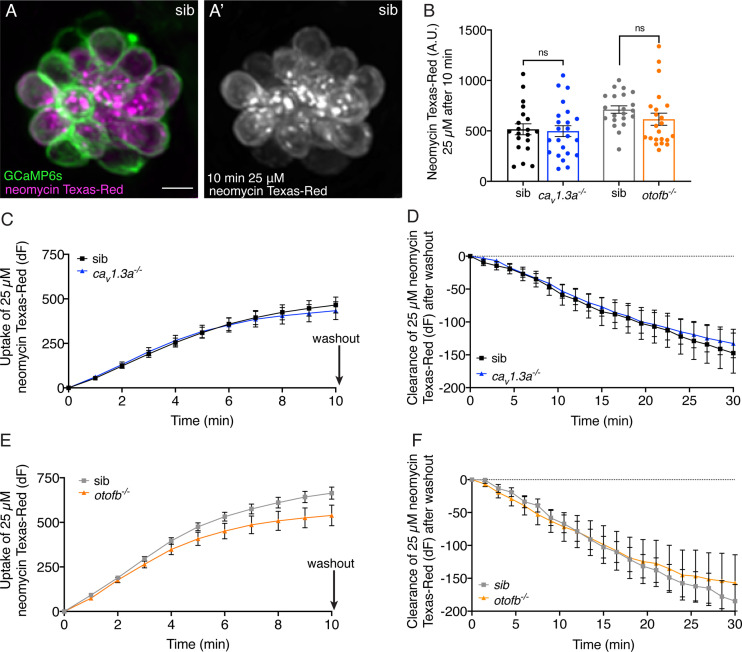
(A-A’) Example of hair cells in a wildtype neuromast after incubation in 25 µM neomycin-Texas Red solution (Neo-TR) for 10 min. GCaMP6s outlines hair cells in A. (B) Average dot plots of Neo-TR fluorescence intensity in neuromasts from cav1.3a-/- (blue) and otofb-/- (orange) mutants and siblings (black and grey, respectively) after a 10-min incubation in 25 µM Neo-TR. No differences in overall neomycin uptake are seen between mutants and siblings. (C–E) Average Neo-TR fluorescence intensity over the course of 10 min 25 µM exposure in cav1.3a-/- mutant neuromasts (blue) and siblings (black) (C) and otofb-/- mutant neuromasts (orange) and siblings (grey) (E). No differences are seen between mutants and siblings in the time course of neomycin uptake. (D–F) Average Neo-TR fluorescence intensity over the course of 30 min following Neo-TR washout in cav1.3a-/- mutant neuromasts (blue) and siblings (black) (D) and otofb-/- mutant neuromasts (orange) and siblings (grey) (F). No significant differences were detected in neomycin clearance or retention between mutants and siblings. Each point in B represents one neuromast. A minimum of 14 neuromasts are averaged for the plots in C-F. A minimum of five animals at 5 dpf were examined per treatment group. Error bars: SEM. For comparisons, unpaired t-tests were used in B, and a two-way ANOVA with a Sidak’s correction for multiple comparisons was used in C-F. Scale bar = 5 µm.