
|
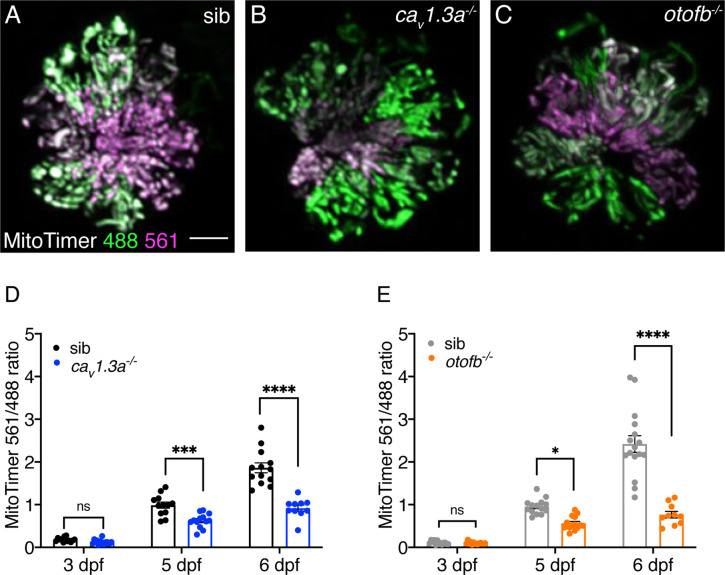
Fig. 6
(A–C) Hair cells in wildtype (A), cav1.3a-/- mutant (B), and otofb-/- mutant (C) Tg[myosin6b:mitoTimer]w208 neuromasts at 5 dpf. (D–E) Average dot plots of the ratio of red/green MitoTimer fluorescence intensity at 3, 5, and 6 dpf in cav1.3a-/- mutant fish (blue) (D) and otofb-/- mutant fish (orange) (E) and respective siblings (black, gray) show that mutants exhibit reduced mitochondrial oxidation over time. Each dot in D and E represents one neuromast. A minimum of 3 animals and 10 neuromasts were examined per treatment group. Error bars: SEM. For comparisons, a two-way ANOVA with a Sidak’s correction for multiple comparisons was used in D-E. * p<0.05, *** p<0.001, **** p<0.0001. Scale bar = 5 µm.