
- Title
-
Paternal hypoxia exposure primes offspring for increased hypoxia resistance
- Authors
- Ragsdale, A., Ortega-Recalde, O., Dutoit, L., Besson, A.A., Chia, J.H.Z., King, T., Nakagawa, S., Hickey, A., Gemmell, N.J., Hore, T., Johnson, S.L.
- Source
- Full text @ BMC Biol.
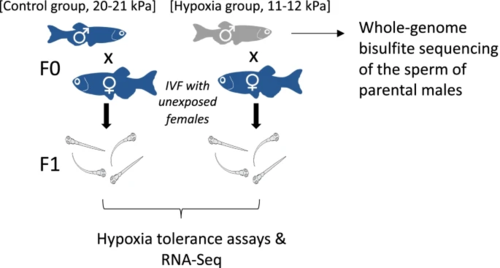
Experimental design. Groups of adult male zebrafish are maintained in normoxia (20?21 kPa, n = 20) or hypoxia (11?12 kPa, n = 20) for 14 days. Five males from each treatment were then used to create F1 progeny, crossing the males to unexposed females (n = 5 families/treatment), with half of the sperm used for whole genome bisulfite sequencing, to assess differential methylation (n = 3 per treatment). At 20?21 days post fertilization, offspring undergo acute hypoxia tolerance (6?8 offspring/family) assays and n = 3 offspring/treatment are used for differential gene expression analysis (RNA-Seq) |
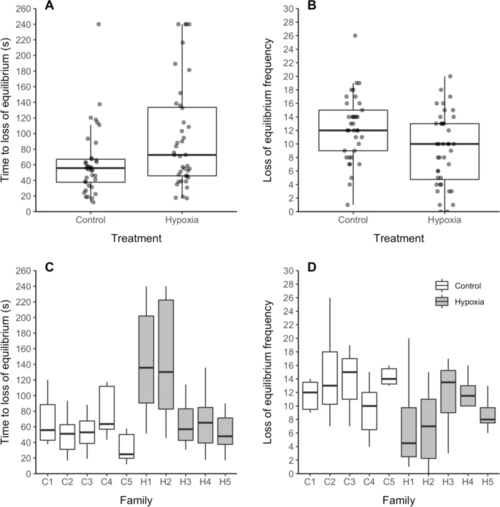
Hypoxia tolerance assays of unexposed offspring of control vs. hypoxia treated males. A, C Time to first loss of equilibrium > 3 s, B, D loss of equilibrium frequency?C and D are broken down by family. N = 6-8 progeny/family � 5 families/treatment. Tolerance assays done at 20?21 days post fertilization, following 14 day parental exposures (20?21 kPa normoxia control vs. 11-?12 kPa hypoxia treatment). Boxes illustrate the interquartile range (medians, 25th and 75th percentiles), and whiskers illustrate 1.5 * the interquartile range, above and below the 75th and 25th percentiles. Statistical analysis: A p = 0.014, B p < 0.0001 treatment effects modeled using generalized linear models. C p = 0.133, D p = 0.014 treatment effects modeled using generalized linear mixed models with family ID included as a random effect |
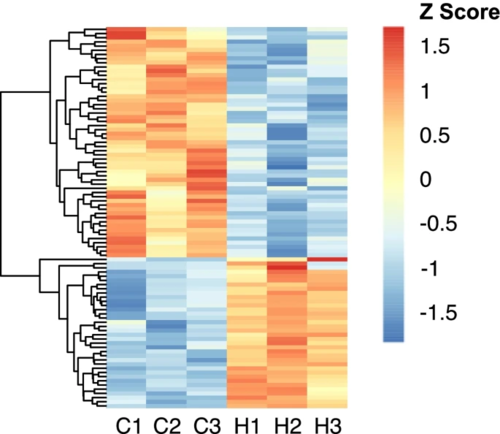
Differential gene expression in offspring of control vs. hypoxia treated males. 91 genes are differentially expressed between the 20?21 day old offspring of hypoxia (n = 3) and control (n = 3) males, with an FDR < 0.05. Red and blue colors represent higher and lower expression, respectively |
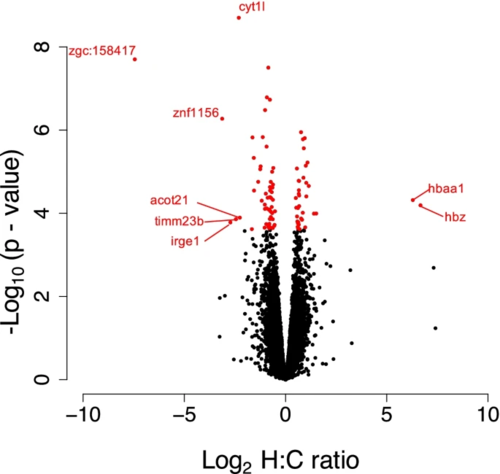
Volcano plot for differentially expressed genes in the offspring of control vs. hypoxia exposed males. 20-21 day old zebrafish F1 offspring from control (n = 3) and hypoxia (n = 3) treated males, showing the distribution of significance [-log10(p-value)] vs. fold change [log2(fold change)] for all genes. Each circle represents a gene, with significant genes (at 5% FDR) highlighted in red. Genes with greater than 4-fold change in expression between control and hypoxia treatments are labeled |
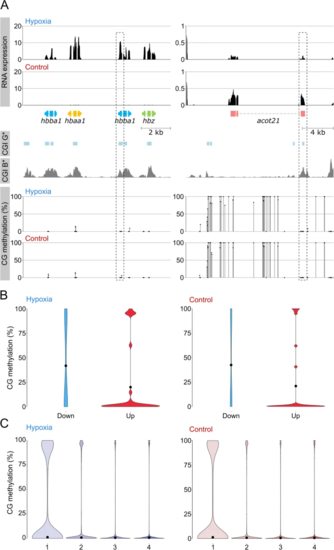
Global methylation changes and relationship between methylation in the sperm of hypoxia vs. control parental males and gene expression in the F1 progeny. A Relationship between CpG methylation and RNA expression for Hb cluster and acot21. CG methylation track shows methylation levels for dinucleotides with >5 calls; CGIs were predicted according to the Gardiner-Garden and Frommer criteria (CGI G*) and CxxC affinity purification (CGI B*). No changes in TSS methylation containing CGIs (dashed box) were observed for both genes (bottom). B Violin plot showing distribution of methylation at transcription start sites (TSS) of differentially expressed genes in the F1 progeny. Downregulated genes are hypermethylated when compared to upregulated genes; however, no clear differences were observed between both conditions. C Violin plot showing distribution of methylation at TSS of genes classified into quartiles according to expression level (highest, 4). Each violin is scaled to the same maximum width (total area is not constant between violins) to demonstrate distributions for each quartile. Black dots denote the median |