
Image
|
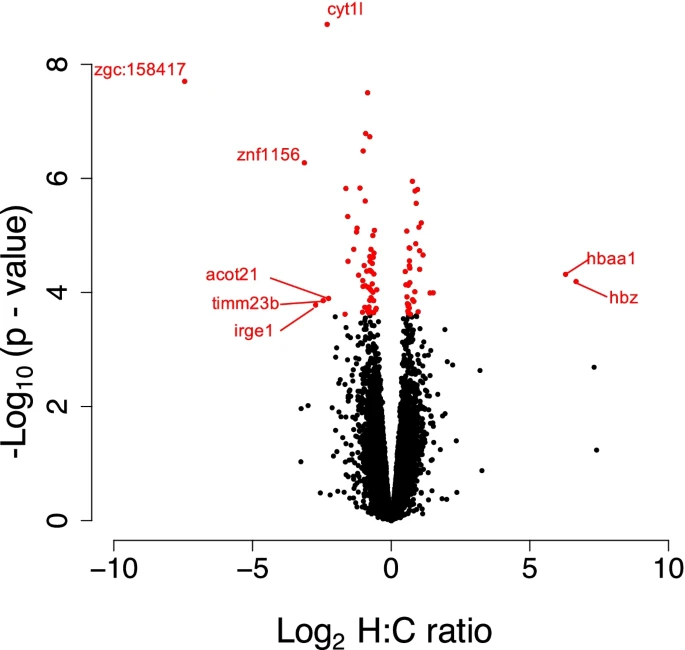
Figure Caption
Fig. 4 Volcano plot for differentially expressed genes in the offspring of control vs. hypoxia exposed males. 20-21 day old zebrafish F1 offspring from control (n = 3) and hypoxia (n = 3) treated males, showing the distribution of significance [-log10(p-value)] vs. fold change [log2(fold change)] for all genes. Each circle represents a gene, with significant genes (at 5% FDR) highlighted in red. Genes with greater than 4-fold change in expression between control and hypoxia treatments are labeled
Acknowledgments
This image is the copyrighted work of the attributed author or publisher, and
ZFIN has permission only to display this image to its users.
Additional permissions should be obtained from the applicable author or publisher of the image.
Full text @ BMC Biol.