
Fig. 5
- ID
- ZDB-FIG-220831-51
- Publication
- Ragsdale et al., 2022 - Paternal hypoxia exposure primes offspring for increased hypoxia resistance
- Other Figures
- All Figure Page
- Back to All Figure Page
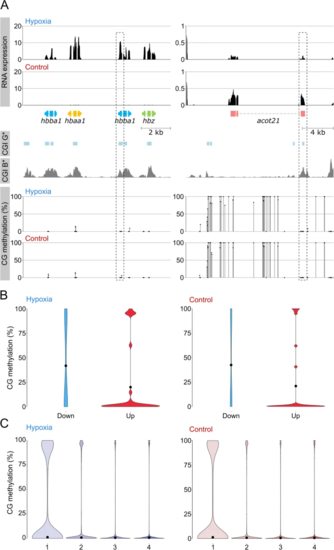
Global methylation changes and relationship between methylation in the sperm of hypoxia vs. control parental males and gene expression in the F1 progeny. A Relationship between CpG methylation and RNA expression for Hb cluster and acot21. CG methylation track shows methylation levels for dinucleotides with >5 calls; CGIs were predicted according to the Gardiner-Garden and Frommer criteria (CGI G*) and CxxC affinity purification (CGI B*). No changes in TSS methylation containing CGIs (dashed box) were observed for both genes (bottom). B Violin plot showing distribution of methylation at transcription start sites (TSS) of differentially expressed genes in the F1 progeny. Downregulated genes are hypermethylated when compared to upregulated genes; however, no clear differences were observed between both conditions. C Violin plot showing distribution of methylation at TSS of genes classified into quartiles according to expression level (highest, 4). Each violin is scaled to the same maximum width (total area is not constant between violins) to demonstrate distributions for each quartile. Black dots denote the median |