
Fig. 2
- ID
- ZDB-FIG-220831-48
- Publication
- Ragsdale et al., 2022 - Paternal hypoxia exposure primes offspring for increased hypoxia resistance
- Other Figures
- All Figure Page
- Back to All Figure Page
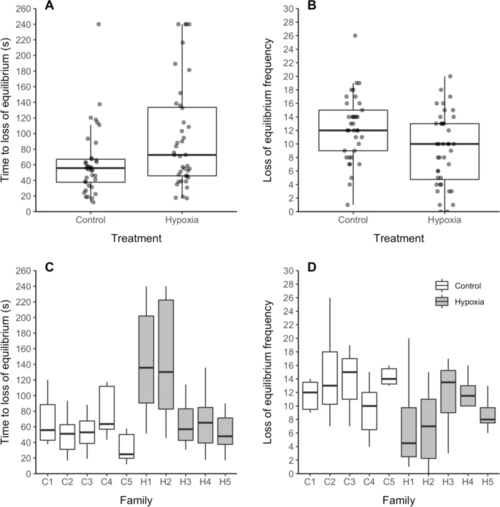
Hypoxia tolerance assays of unexposed offspring of control vs. hypoxia treated males. A, C Time to first loss of equilibrium > 3 s, B, D loss of equilibrium frequency—C and D are broken down by family. N = 6-8 progeny/family × 5 families/treatment. Tolerance assays done at 20–21 days post fertilization, following 14 day parental exposures (20–21 kPa normoxia control vs. 11-–12 kPa hypoxia treatment). Boxes illustrate the interquartile range (medians, 25th and 75th percentiles), and whiskers illustrate 1.5 * the interquartile range, above and below the 75th and 25th percentiles. Statistical analysis: A p = 0.014, B p < 0.0001 treatment effects modeled using generalized linear models. C p = 0.133, D p = 0.014 treatment effects modeled using generalized linear mixed models with family ID included as a random effect |