
- Title
-
Sema4C Is Required for Vascular and Primary Motor Neuronal Patterning in Zebrafish
- Authors
- Sheng, J., Jiang, B., Shi, R., Shi, L., Liu, D.
- Source
- Full text @ Cells

sema4C is highly conserved during evolution. (A). Phylogenetic tree and domain structure of sema4C protein; (B). Alignment of the protein sequences of the sema domain of sema4C in Danio rerio, Homo sapiens, Mus musculus, Oryzias latipes, Rattus norvegicus, Oryctolagus cuniculus and Xenopus tropicalis. These protein sequences were aligned using MEGA7 software and edited by TBtools. |
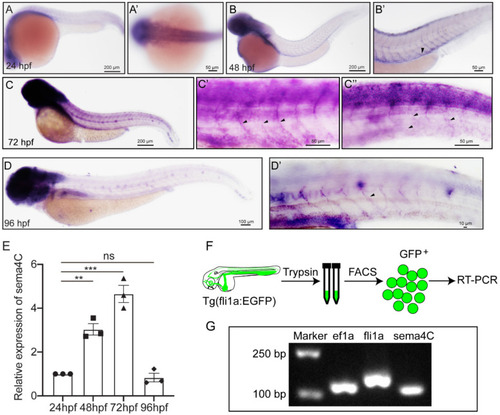
Expression of sema4C gene in embryonic zebrafish at different stages. (A). Whole mount in situ hybridization (WISH) analysis of sema4C in zebrafish embryos and the magnified image of the head at 24 hpf (A’); (B–D). WISH analysis of sema4C in zebrafish embryos and the magnified images of the trunk at 48 hpf (B’), 72 hpf (C’,C”) and 96 hpf (D,D’), black arrow-heads indicate blood vessels; (E). Expression analysis of sema4C genes in embryonic zebrafish at different stages by QRT-PCR. Triangles, squares, dots and diamonds represent data at different time points respectively. One-way ANOVA, *** p < 0.001, ** p < 0.01, ns, no significance; (F). The procedure of the endothelial cells sorting and RT-PCR; (G). The agarose gel electrophoresis results of RT-PCR on fli1a-EGFP sorted cells. |
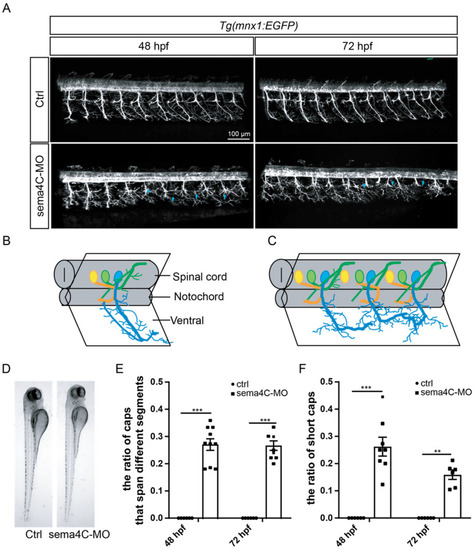
The abnormal development of primary motor neurons in the sema4C deficiency zebrafish. (A). Confocal imaging analysis of primary motor neurons in control and sema4C knockdown Tg(mnx1:EGFP) zebrafish at 48 and 72 hpf, blue arrowheads indicate aberrant Caps; (B). The schematic diagram for three different primary motor neurons in the control fish; (C). The schematic diagram for the abnormal pattern in the sema4C morphants, in which the axonal trajectories of Caps were dramatically misled; (D). Zebrafish embryos of control and sema4C-MO injected at 72 hpf imaged in bright field; (E). The statistical analysis of the ratio of Caps across different segments in the control and sema4C morphants at 48 and 72 hpf. Mann–Whitney test, 48 hpf: *** p = 0.0007; *** 72 hpf: p = 0.0007; (F). The statistical analysis of the ratio of short Caps in the wild types and sema4C morphants at 48 and 72 hpf. Mann–Whitney test, 48 hpf: *** p = 0.0007; 72 hpf: ** p = 0.0022. EXPRESSION / LABELING:
PHENOTYPE:
|
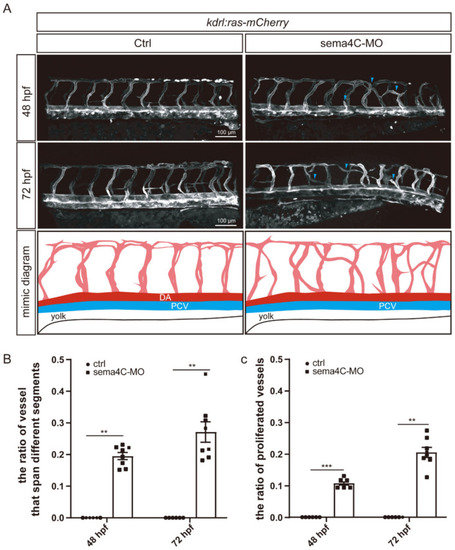
Deficiency of sema4C leads to abnormal vascular networks. (A). Confocal imaging and the schematic diagram of ISVs in the control and sema4C-MO Tg(kdrl:ras-mCherry) zebrafish at different stages. As shown in the diagram, ISVs in the control group were orderly arranged and grew upwards, while ISVs’ growth turned to horizontal germination and connected to adjacent ISVs, or even the opposite ISVs. In sema4C knockdown of zebrafish, blue arrowheads indicate aberrant ISVs; (B). The statistical analysis of the ratio of vessels that crossed different segments in the control and sema4C morphants at different stages—Mann–Whitney test, 48 hpf: ** p = 0.0012; 72 hpf: ** p = 0.0012; (C). The statistical analysis of proliferated vessel ratio in the control and sema4C morphants at different stages—Mann–Whitney test, 48 hpf: *** p = 0.0006; 72 hpf: ** p = 0.0012. EXPRESSION / LABELING:
PHENOTYPE:
|
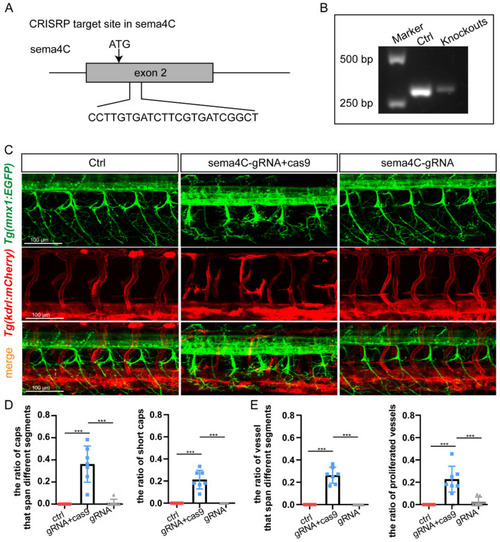
Knockout of sema4C caused both aberrant phenotypes in PMNs and ISVs. (A). The targeting site of the gRNA on the sema4C gene; (B). The measure of cutting efficiency using genomic DNAs of injected embryonic (n = 10); (C). Confocal imaging analysis of PMNs and ISVs in control and the F0 generation of the injected Tg(mnx1:EGFP::kdrl:ras-mCherry) zebrafish at 48 hpf, blue arrowheads indicate aberrant PMN and ISV; (D). The statistical analysis of the proportion of abnormal axonal trajectories of Caps (*** p = 0.0006) and short Caps (*** p = 0.0006) in the different groups at 48 hpf. Mann–Whitney test; (E). The statistical analysis of the proportion of vessels that extend across different segments (*** p = 0.0006) and the proportion of proliferated vessels (*** p = 0.006) in the different groups at 48 hpf. Mann–Whitney test. |

Overexpressing sema4C partially rescued the abnormal of PMNs and ISVs in sema4C deficient embryos. (A). Confocal imaging analysis of PMNs in control and sema4C morphants at 72 hpf, blue arrowheads indicate aberrant PMNs and ISVs; (B). The statistical analysis of the proportion of deficient axonal trajectories of Caps (*** p = 0.0006) and short Caps (*** p = 0.0006) in the sema4C morphants and sema4C rescue groups at 72 hpf. Dots and squares represent the data of the experimental group and the rescue group, respectively. Mann–Whitney test; (C). Confocal imaging analysis of ISVs in control and sema4C morphants at 48 hpf; (D). The statistical analysis of the ratio of vessels that span different segments (* p = 0.035) and the proportion of proliferated vessels (* p = 0.0262) in the sema4C morphants and sema4C rescue groups at 48 hpf. Dots and squares represent the data of the experimental group and the rescue group, respectively. Mann–Whitney test. |