
- Title
-
In vivo drug discovery for increasing incretin-expressing cells identifies DYRK inhibitors that reinforce the enteroendocrine system
- Authors
- Chu, L., Terasaki, M., Mattsson, C.L., Teinturier, R., Charbord, J., Dirice, E., Liu, K.C., Miskelly, M.G., Zhou, Q., Wierup, N., Kulkarni, R.N., Andersson, O.
- Source
- Full text @ Cell Chem Biol
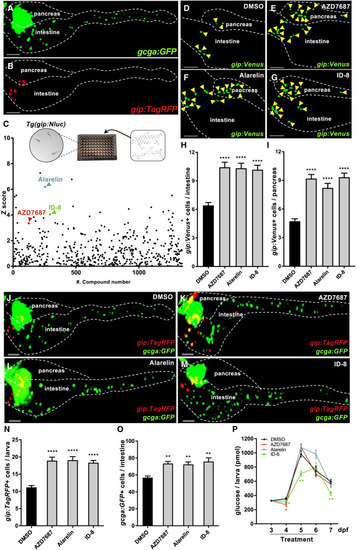
Figure 1. In vivo chemical screening identified small molecules increasing the number of incretin-expressing cells in zebrafish (A and B) Representative confocal projections of a 6 days post fertilization (dpf) Tg(gip:TagRFP);Tg(gcga:GFP) larva. The expression of Tg(gcga:GFP) (A) mainly appeared in the pancreatic islet and enteroendocrine cells throughout the gut, whereas Tg(gip:TagRFP) (B) mainly appeared in enteroendocrine cells of upper gut in the intestinal bulb and pancreas. Scale bars, 100 μm. (C) Top: Schematic depicting the screening for compounds stimulating the expressing of gip in whole zebrafish larvae. Three Tg(gip:Nluc) zebrafish larvae at 3 dpf were transferred to each well of 96-well plates. A compound from the MedChemExpress library was added to each well containing 200 μL E3 + PTU solution. At 6 dpf, the luminescence activity was measured. Bottom: Three hits were identified, including AZD7687, Alarelin, and ID-8. Data are shown with calculated Z-score of compounds from the MedChemExpress library. Tg(gip:Nluc) larvae were treated from 3 to 6 dpf with DMSO or one of the 1,303 chemicals. Luminescence activity was measured at 6 dpf and displayed as Z-scores. (D–I) The hits promote the generation of gip-expressing cells both in the intestine and pancreas in zebrafish larvae. (D–G) Representative confocal images of Tg(gip:Venus) larvae treated from 3 to 6 dpf with DMSO (D) or the hits including AZD7687 (E), Alarelin (F), and ID-8 (G). Yellow arrowheads show gip:Venus positive cells. Scale bars, 50 μm. (H) Quantification of the number of gip:Venus-positive cells in the intestine of 6 dpf Tg(gip:Venus) larvae after the treatments in (D–G). n = 40–57 larvae per group. ∗∗∗∗p < 0.0001. (I) Quantification of the number of gip:Venus-positive cells in the pancreas of Tg(gip:Venus) after the treatments in (D–G). n = 38–57 larvae per group. ∗∗∗∗p < 0.0001. (J–O) Hit compounds promotes the generation of K-cells and L-cells in the intestines of zebrafish larvae. (J–M) Representative confocal projections of Tg(gip:TagRFP); Tg(gcga:GFP) larvae treated from 3 to 6 dpf with DMSO (J), AZD7687 (K), Alarelin (L), or ID-8 (M), displaying gip:TagRFP-expressing cells in red and gcga:GFP expressing cells in green. The same larva is displayed with single and merged channels in Figures 1A and 1B and 1J. Scale bars, 100 μm. (N) Quantification of the total number of K-cells in Tg(gip:TagRFP);Tg(gcga:GFP) larvae after treatment. n = 17–23 larvae per group. (O) Quantification of the total number of L-cells in the intestines of Tg(gip:TagRFP);Tg(gcga:GFP) larvae after treatment. Since gcga:GFP-expressing cells were lumped in the islet, we did not quantify the number of these cells in the pancreas. n = 10–12 larvae per group. ∗∗∗∗p < 0.0001, ∗∗p < 0.01. (P) Free glucose levels (i.e., glucose that has not been phosphorylated) were measured in wild-type zebrafish larvae treated from 3 to 6 dpf with DMSO, AZD7687, Alarelin, or ID-8. We sampled larvae for free glucose levels in consecutive days from 3 to 7 dpf. Free glucose levels were significantly lower in the larvae treated with ID-8 (green line) than those with DMSO (black line) at 4, 5, and 7 dpf; the only other significance was the AZD7687-treated group at 4 dpf. n = 16 larvae (8 pools of 2 larvae) per data point, ∗∗p < 0.01, ∗p < 0.05. See also Figure S1. |
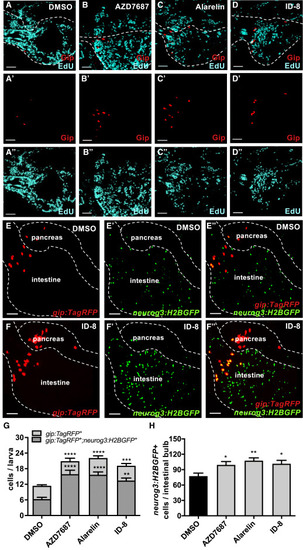
Figure 2. The hits promote neogenesis of K-cells originating from neurog3+ progenitor cells (A–D) No proliferation of K-cells was observed in the intestines after treatment with the hits. Representative confocal projection images of gip:TagRFP-expressing cells (in red) and EdU positive cells (in cyan blue) in the intestines of Tg(gip:TagRFP) zebrafish larvae treated from 3 to 6 days post fertilization (dpf) with DMSO (A), AZD7687 (B), Alarelin (C), or ID-8 (D). Gip-expressing cells were stained with α-Gip antibody. Split channels are shown in A′–D′ and A″–D″. White dashed lines outline the intestines. Scale bars, 50 μm. (E–H) The newly generated K-cells comes from neurog3-expressing progenitor cells. (E and F) Representative confocal images of Tg(gip:TagRFP);Tg(neurog3:H2BGFP) larvae treated from 3 to 6 dpf with DMSO or ID-8, displaying gip:TagRFP-expressing cells in red (E and F), neurog3:H2BGFP-expressing cells in green (E′ and F′), and overlapping gip:TagRFP;neurog3:H2BGFP expression in yellow (E″ and F″). Scale bars, 100 μm. (G) Quantification of the total number of K-cells and cells co-expressing gip:TagRFP and neurog3:H2BGFP after treatment with DMSO (n = 7), AZD7687 (n = 10), Alarelin (n = 9), or ID-8 (n = 7). ∗∗∗∗p < 0.0001, ∗∗∗∗p < 0.0001, ∗∗p < 0.01. (H) Quantification of the number of neurog3:H2BGFP-positive cells in the intestinal bulb of Tg(gip:TagRFP);Tg(neurog3:H2BGFP) after the different treatments. n = 7–12 larvae per group. ∗∗p < 0.01, ∗p < 0.05. |
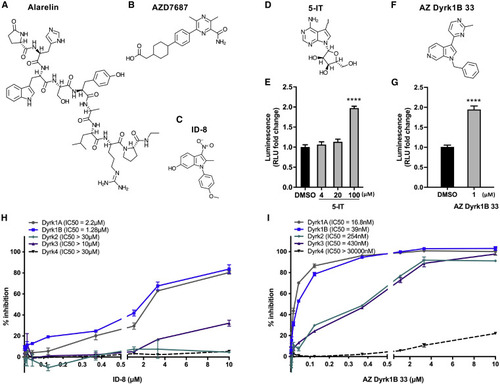
Figure 3. Structures of the hits and specificity of ID-8 and AZ Dyrk1B 33 on DYRKs (A–C) Chemical structures of the hits. Alarelin (A), AZD7687 (B), and ID-8 (C). (D–G) Chemical structures of the additional DYRK inhibitors followed up on, i.e., 5-IT (D) and AZ Dyrk1B 33 (F); and luminescence in Tg(gip:Nluc) zebrafish larvae treated from 3 to 6 days post fertilization (dpf) with 4, 20, and 100 μM 5-IT (E) or 1 μM AZ Dyrk1B 33 (G) (≥4 μM AZ Dyrk1B 33 was toxic to the zebrafish), normalized to DMSO. ∗∗∗∗p < 0.0001. (H and I) Specificity analyses of ID-8 (H) and AZ Dyrk1B 33 (I) on the DYRK-family of kinases by dose-response assessment in vitro. The SelectScreen biochemical kinase profiling assays were performed by ThermoFisher Scientific, using LanthaScreen for DYRK2 and Z′-LYTE for DYRK1A, DYRK1B, DYRK3, and DYRK4. See also Figure S2 and S3. |

Figure 4. Inhibition of Dyrk1b, but not Dyrk1a, promotes Glucagon/GLP-1 expression in a mouse enteroendocrine cell line (A and B) AZ Dyrk1B 33 stimulates Tg(gip:Nluc) activity and acts via NFAT-calcineurin signaling. The effect of AZ Dyrk1B 33 (1 μM) on increasing the luminescence activity in Tg(gip:Nluc) transgenics can be inhibited by either 2 μM cyclosporine A (CsA) (A) or 10 μM NFAT-calcineurin association-6 (INCA6) (B). n = 4 wells per group. ∗∗∗p < 0.001. ∗∗p < 0.01. (C) Quantification of Glucagon expression in GLUTag cells with qPCR, after genetic silencing using control small interfering RNA (siRNA) and siRNA targeting Dyrk1a or Dyrk1b. n = 6 per group. ∗∗p < 0.01. (D) Glucagon expression in GLUTag cells assessed with qPCR upon control, Dyrk1a or Dyrk1b knock-down could be reversed by either calcineurin inhibitor, i.e. CsA or INCA6. n = 3 per group. ∗∗∗∗p < 0.0001. (E–J) GLP-1 expression in GLUTag cells is stimulated after treatment with DYRK inhibitors. Representative confocal images of GLUTag cells stained for GLP-1 (red) and DAPI (grey) after treatment with DMSO (E, H), ID-8 (F), or AZ Dyrk1b 33 (I). Scale bars, 20 μm. Quantification of GLP-1 staining intensity per cell after treatment with ID-8 (G) or AZ Dyrk1b 33 (J) for 24 h n = 8 per group. ∗∗p < 0.01, ∗∗∗∗p < 0.0001. |
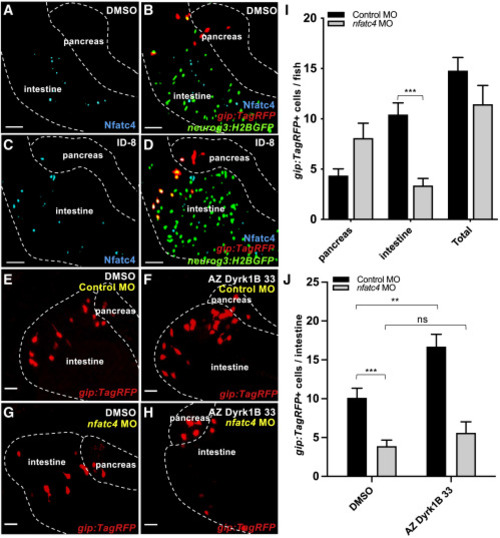
Figure 5. Nfatc4 is required for enteroendocrine cell differentiation (A–D) Expression of Nfatc4, gip:TagRFP, and neurog3:H2BGFP in zebrafish larvae. Representative confocal images of Nfatc4 immunofluorescently stained cells, neurog3-expressing enteroendocrine progenitor cells, and K-cells in Tg(neurog3:H2BGFP);Tg(gip:TagRFP) zebrafish larvae treated from 3 to 6 days post fertilization (dpf) with either DMSO (A and B) or ID-8 (C and D), displaying Nfatc4 immunofluorescently stained cells in cyan blue, neurog3:H2BGFP-expressing cells in green, and gip:TagRFP-expressing cells in red. Scale bars, 50 μm. (E–J) Knock-down of nfatc4 decreases the number of K-cells in zebrafish intestines. (E–H) Representative confocal images of gip:TagRFP-expressing cells in 5 dpf larvae injected with control morpholinos or nfatc4 morpholinos, and later treated with DMSO (E and G) or AZ Dyrk1B 33 (F and H) from 3 to 5 dpf, displaying gip:TagRFP-expressing cells in red. Scale bars, 20 μm. (I) Quantification of gip:TagRFP-expressing cells in pancreas, intestines, and the total number at 5 dpf in Tg(gip:TagRFP) zebrafish larvae injected with control or nfatc4 morpholinos. n = 11–14 larvae per group. ∗∗∗p < 0.001. (J) Quantification of gip:TagRFP-expressing cells in intestines of 5 dpf larvae injected with control or nfatc4 morpholinos, and later treated with DMSO or AZ Dyrk1B 33 from 3 to 5 dpf. n = 9–10 larvae per group. ∗∗∗p < 0.001, ∗∗p < 0.01. |

Figure 6. AZ Dyrk1B 33 increases the prevalence of incretin+ cells and improves glucose control in diabetic mice (A and B) AZ Dyrk1B 33 improves the normalization of glucose during OGTT in diabetic mice. (A) Pooled data from two OGTT experiments in BKS db/db mice treated by AZ Dyrk1B 33 or vehicle. The mice were fasted before the administration of glucose (0.5 mg/kg). (B) The area under the curve for the OGTT in (A) (0–120 min). ∗∗p < 0.005, ∗p < 0.05. n = 10 AZ Dyrk1B 33-treated mice; and n = 9 vehicle-treated mice. (C) The serum GIP level increases in AZ Dyrk1B 33-treated diabetic mice after a glucose challenge. Blood samples were collected before and at 15 min after the administration of glucose (0.5 mg/kg). GIP levels were normalized to the corresponding GIP levels in the sera sampled in the fasted state before the administration of glucose. ∗p < 0.05. (D–G) AZ Dyrk1B 33 increases the number of incretin+ cells in diabetic mice. (D and E) Representative confocal images of the small intestines of mice treated with vehicle or AZ Dyrk1B 33, displaying K-cells in green, L-cells in red, and DAPI in blue. Scale bars, 100 μm. (F and G) Quantification of the number of GIP-expressing K-cells (F) and GLP-1-expressing L-cells (G). The total numbers of cells were normalized to the DAPI area (per mm2). n = 4 mice per group. ∗∗p < 0.001. (H–J) AZ Dyrk1B 33 does not change the amount of α- or β-cells in diabetic mouse pancreata. (H and I) Representative confocal images of the pancreata of BKS db/db mice treated with vehicle (H) or AZ Dyrk1B 33 (I), displaying β-cells in green, α-cells in red, and DAPI in blue. Scale bars, 100 μm. (J) Quantification of α- and β-cell mass. n = 4 mice per group. See also Figure S4. |