
Fig. 2
- ID
- ZDB-FIG-220921-2
- Publication
- Chu et al., 2022 - In vivo drug discovery for increasing incretin-expressing cells identifies DYRK inhibitors that reinforce the enteroendocrine system
- Other Figures
- All Figure Page
- Back to All Figure Page
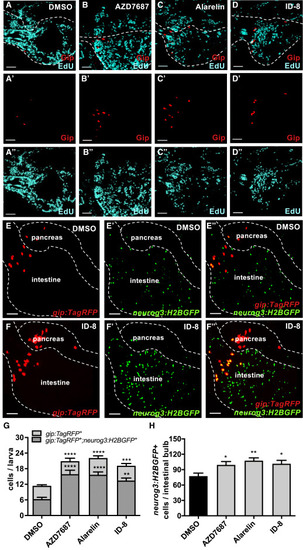
Figure 2. The hits promote neogenesis of K-cells originating from neurog3+ progenitor cells (A–D) No proliferation of K-cells was observed in the intestines after treatment with the hits. Representative confocal projection images of gip:TagRFP-expressing cells (in red) and EdU positive cells (in cyan blue) in the intestines of Tg(gip:TagRFP) zebrafish larvae treated from 3 to 6 days post fertilization (dpf) with DMSO (A), AZD7687 (B), Alarelin (C), or ID-8 (D). Gip-expressing cells were stained with α-Gip antibody. Split channels are shown in A′–D′ and A″–D″. White dashed lines outline the intestines. Scale bars, 50 μm. (E–H) The newly generated K-cells comes from neurog3-expressing progenitor cells. (E and F) Representative confocal images of Tg(gip:TagRFP);Tg(neurog3:H2BGFP) larvae treated from 3 to 6 dpf with DMSO or ID-8, displaying gip:TagRFP-expressing cells in red (E and F), neurog3:H2BGFP-expressing cells in green (E′ and F′), and overlapping gip:TagRFP;neurog3:H2BGFP expression in yellow (E″ and F″). Scale bars, 100 μm. (G) Quantification of the total number of K-cells and cells co-expressing gip:TagRFP and neurog3:H2BGFP after treatment with DMSO (n = 7), AZD7687 (n = 10), Alarelin (n = 9), or ID-8 (n = 7). ∗∗∗∗p < 0.0001, ∗∗∗∗p < 0.0001, ∗∗p < 0.01. (H) Quantification of the number of neurog3:H2BGFP-positive cells in the intestinal bulb of Tg(gip:TagRFP);Tg(neurog3:H2BGFP) after the different treatments. n = 7–12 larvae per group. ∗∗p < 0.01, ∗p < 0.05. |