
Fig. 5
- ID
- ZDB-IMAGE-220921-5
- Publication
- Chu et al., 2022 - In vivo drug discovery for increasing incretin-expressing cells identifies DYRK inhibitors that reinforce the enteroendocrine system
- All Figures
- Figures for Chu et al., 2022
|
Fig. 5
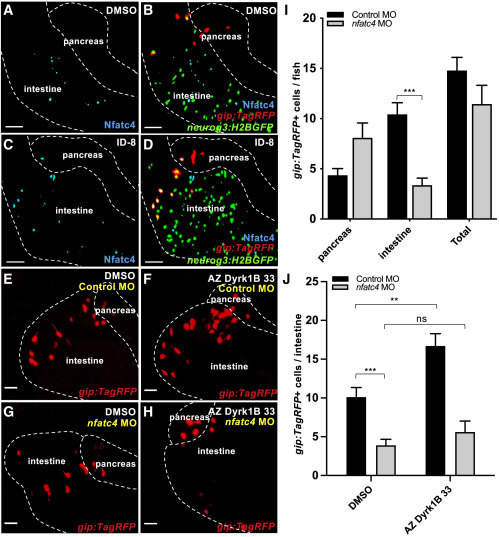
Figure 5. Nfatc4 is required for enteroendocrine cell differentiation (A–D) Expression of Nfatc4, gip:TagRFP, and neurog3:H2BGFP in zebrafish larvae. Representative confocal images of Nfatc4 immunofluorescently stained cells, neurog3-expressing enteroendocrine progenitor cells, and K-cells in Tg(neurog3:H2BGFP);Tg(gip:TagRFP) zebrafish larvae treated from 3 to 6 days post fertilization (dpf) with either DMSO (A and B) or ID-8 (C and D), displaying Nfatc4 immunofluorescently stained cells in cyan blue, neurog3:H2BGFP-expressing cells in green, and gip:TagRFP-expressing cells in red. Scale bars, 50 μm. (E–J) Knock-down of nfatc4 decreases the number of K-cells in zebrafish intestines. (E–H) Representative confocal images of gip:TagRFP-expressing cells in 5 dpf larvae injected with control morpholinos or nfatc4 morpholinos, and later treated with DMSO (E and G) or AZ Dyrk1B 33 (F and H) from 3 to 5 dpf, displaying gip:TagRFP-expressing cells in red. Scale bars, 20 μm. (I) Quantification of gip:TagRFP-expressing cells in pancreas, intestines, and the total number at 5 dpf in Tg(gip:TagRFP) zebrafish larvae injected with control or nfatc4 morpholinos. n = 11–14 larvae per group. ∗∗∗p < 0.001. (J) Quantification of gip:TagRFP-expressing cells in intestines of 5 dpf larvae injected with control or nfatc4 morpholinos, and later treated with DMSO or AZ Dyrk1B 33 from 3 to 5 dpf. n = 9–10 larvae per group. ∗∗∗p < 0.001, ∗∗p < 0.01.