
Fig. 1
- ID
- ZDB-IMAGE-220921-1
- Publication
- Chu et al., 2022 - In vivo drug discovery for increasing incretin-expressing cells identifies DYRK inhibitors that reinforce the enteroendocrine system
- All Figures
- Figures for Chu et al., 2022
|
Fig. 1
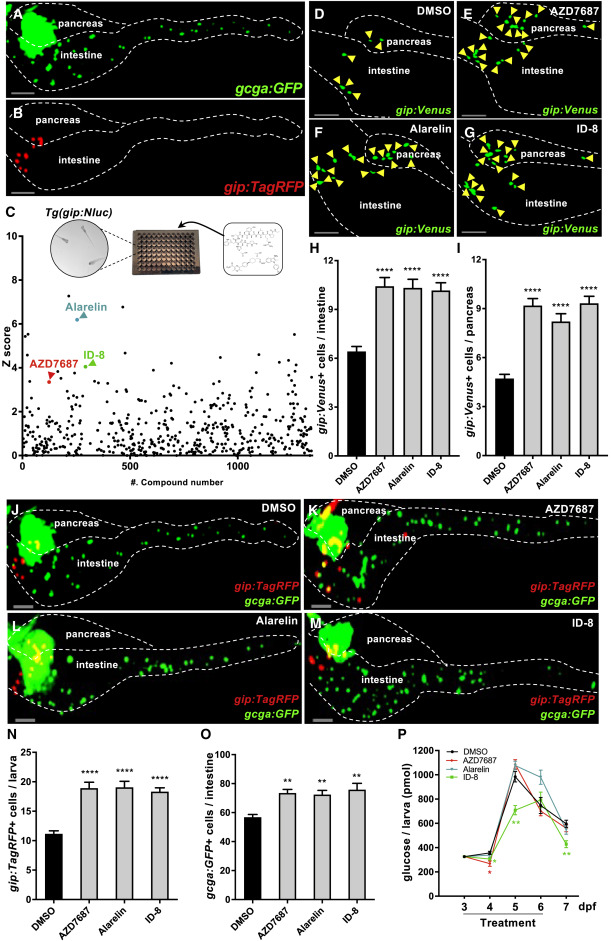
Figure 1. In vivo chemical screening identified small molecules increasing the number of incretin-expressing cells in zebrafish (A and B) Representative confocal projections of a 6 days post fertilization (dpf) Tg(gip:TagRFP);Tg(gcga:GFP) larva. The expression of Tg(gcga:GFP) (A) mainly appeared in the pancreatic islet and enteroendocrine cells throughout the gut, whereas Tg(gip:TagRFP) (B) mainly appeared in enteroendocrine cells of upper gut in the intestinal bulb and pancreas. Scale bars, 100 μm. (C) Top: Schematic depicting the screening for compounds stimulating the expressing of gip in whole zebrafish larvae. Three Tg(gip:Nluc) zebrafish larvae at 3 dpf were transferred to each well of 96-well plates. A compound from the MedChemExpress library was added to each well containing 200 μL E3 + PTU solution. At 6 dpf, the luminescence activity was measured. Bottom: Three hits were identified, including AZD7687, Alarelin, and ID-8. Data are shown with calculated Z-score of compounds from the MedChemExpress library. Tg(gip:Nluc) larvae were treated from 3 to 6 dpf with DMSO or one of the 1,303 chemicals. Luminescence activity was measured at 6 dpf and displayed as Z-scores. (D–I) The hits promote the generation of gip-expressing cells both in the intestine and pancreas in zebrafish larvae. (D–G) Representative confocal images of Tg(gip:Venus) larvae treated from 3 to 6 dpf with DMSO (D) or the hits including AZD7687 (E), Alarelin (F), and ID-8 (G). Yellow arrowheads show gip:Venus positive cells. Scale bars, 50 μm. (H) Quantification of the number of gip:Venus-positive cells in the intestine of 6 dpf Tg(gip:Venus) larvae after the treatments in (D–G). n = 40–57 larvae per group. ∗∗∗∗p < 0.0001. (I) Quantification of the number of gip:Venus-positive cells in the pancreas of Tg(gip:Venus) after the treatments in (D–G). n = 38–57 larvae per group. ∗∗∗∗p < 0.0001. (J–O) Hit compounds promotes the generation of K-cells and L-cells in the intestines of zebrafish larvae. (J–M) Representative confocal projections of Tg(gip:TagRFP); Tg(gcga:GFP) larvae treated from 3 to 6 dpf with DMSO (J), AZD7687 (K), Alarelin (L), or ID-8 (M), displaying gip:TagRFP-expressing cells in red and gcga:GFP expressing cells in green. The same larva is displayed with single and merged channels in Figures 1A and 1B and 1J. Scale bars, 100 μm. (N) Quantification of the total number of K-cells in Tg(gip:TagRFP);Tg(gcga:GFP) larvae after treatment. n = 17–23 larvae per group. (O) Quantification of the total number of L-cells in the intestines of Tg(gip:TagRFP);Tg(gcga:GFP) larvae after treatment. Since gcga:GFP-expressing cells were lumped in the islet, we did not quantify the number of these cells in the pancreas. n = 10–12 larvae per group. ∗∗∗∗p < 0.0001, ∗∗p < 0.01. (P) Free glucose levels (i.e., glucose that has not been phosphorylated) were measured in wild-type zebrafish larvae treated from 3 to 6 dpf with DMSO, AZD7687, Alarelin, or ID-8. We sampled larvae for free glucose levels in consecutive days from 3 to 7 dpf. Free glucose levels were significantly lower in the larvae treated with ID-8 (green line) than those with DMSO (black line) at 4, 5, and 7 dpf; the only other significance was the AZD7687-treated group at 4 dpf. n = 16 larvae (8 pools of 2 larvae) per data point, ∗∗p < 0.01, ∗p < 0.05. See also Figure S1.