FIGURE SUMMARY
Title

Modeling Lung Carcinoids with Zebrafish Tumor Xenograft

Authors
Carra, S., Gaudenzi, G., Dicitore, A., Cantone, M.C., Plebani, A., Saronni, D., Zappavigna, S., Caraglia, M., Candeo, A., Bassi, A., Persani, L., Vitale, G.
Source
Full text @ Int. J. Mol. Sci.

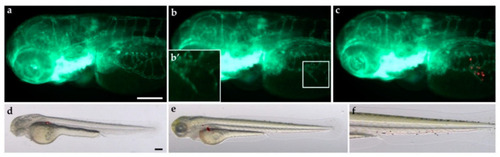
Engraftment of lung carcinoid cells in zebrafish embryos. Representative epifluorescence images of Tg(fli1a:EGFP)y1 embryos injected with cell resuspension solution (control: a,b) and implanted with red-stained NCI-H835, UMC-11, NCI-H727, and NCI-H720 cells (cr). Embryos were imaged at 24 (a,c,d,g,h,k,l,o,p) and 48 (b,e,f,i,j,m,n,q,r) hpi. The red channel was omitted in panels (c,e,g,i,k,m,o,q) to facilitate the observation of tumor-induced angiogenesis (green). (c′,e′,g′,i′,k′,m′,o′,q′) are the digital magnifications of white-boxed regions. The graphs showed the quantification of tumor-induced angiogenesis in embryos implanted with lung carcinoid cells after 24 (s) and 48 (t) hpi. NCI-H720 values have been set to 1.0. Graphed values represent the mean ± S.E.M. ** p < 0.01 vs. NCI-H720; *** p < 0.001 vs. NCI-H720. All implanted cells stimulated endothelial sprouting from the SIV plexus within 24 hpi. Embryos are shown anterior to the left. Scale bar: 100 µm.

Lung carcinoid cell invasiveness in grafted zebrafish embryos. Overlay of representative fluorescent and bright field images of embryos grafted with red-stained NCI-H835, UMC-11, NCI-H727, and NCI-H720 cells at 0 (a,d,g,j) and 48 hpi (b,e,h,k), respectively. For each injected cell line, the tail, particularly at 48 hpi, was imaged (c,f,i,l). Images showed the spread of carcinoid cells throughout the embryo body. The graph showed the quantification of tumor cell migration in the tail of embryos implanted with lung carcinoid cells after 48 hpi (m). As an arbitrary unit of migration, we considered the number of fluorescent particles in the tail. NCI-H727 values have been set to 1.0. Graphed values represent the mean ± S.E.M. *** p < 0.001 vs. NCI-H720. Embryos are shown anterior to the left. Scale bar: 100 µm.

Tumorigenic potential of a lung carcinoid PDX in zebrafish embryos. Red-stained cells, obtained from a patient surgical resection, were used to perform PDX in 48 hpf Tg(fli1a:EGFP)y1 zebrafish embryos. Epifluorescence images at 24 hpi of cell resuspension solution injected embryos (control: a) and patient-derived lung carcinoid (red) xenografted embryos (b,c). The red channel was omitted in panels (b,b′) to facilitate the observation of tumor-induced angiogenesis (green); b′ is the digital magnification of the white-boxed region. Lung carcinoid PDX induced the formation of endothelial structures (green) sprouting from the SIV within 24 hpi. Overlay of representative fluorescent and bright field images of grafted embryos at 0 (d) and 48 hpi (e,f) showed the spread of tumor cells throughout the embryo body. The tail, particularly at 48 hpi, was imaged (f). Embryos are shown anterior to the left. Scale bar: 100 µm.

Time-lapse imaging of lung carcinoid cell grafted embryos performed with selective plane illumination microscopy. Representative maximum intensity projections of volumetric stacks acquired of Tg(fli1a:EGFP)y1 zebrafish embryos at the level of the graft regions captured every 4 h until 24 hpi. Embryos were implanted with NCI-H835 (a), UMC-11 (b), NCI-H727 (c), and NCI-H720 (d) cells. Embryos are shown anterior to the left. Scale bar: 100 μm.

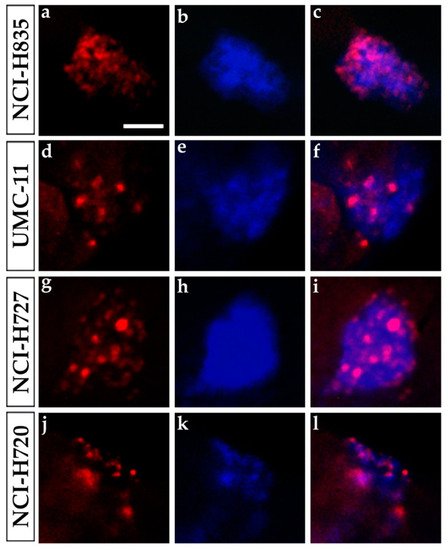
Ki-67 immunostaining of lung carcinoid grafted embryos. Representative images of 48 hpi Tg(fli1a:EGFP)y1 zebrafish embryos at the level of the graft regions after immunofluorescence assay to detect Ki-67 localization (red). Embryos were implanted with NCI-H835 (ac), UMC-11 (df), NCI-H727 (gi), and NCI-H720 (jl) cells. Injected lung carcinoid cells were previously blue-stained (b,e,h,k). The merge of red and blue channels (c,f,i,l) showed that Ki-67 staining is tumor cell specific. Scale bar: 50 µm.

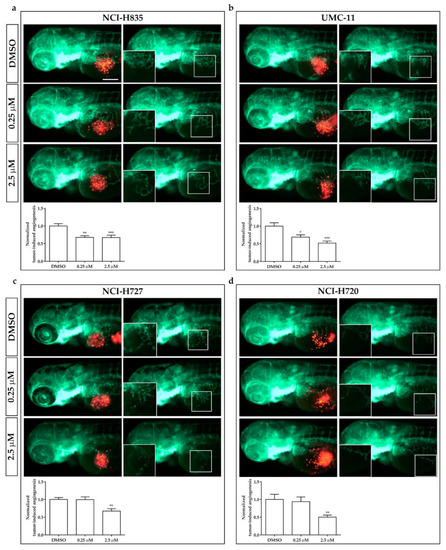
Effects of sulfatinib on tumor-induced angiogenesis in zebrafish embryos implanted with lung carcinoid cells. Representative epifluorescence images of Tg(fli1a:EGFP)y1 zebrafish embryos at 24 hpi, implanted with NCI-H835 (a), UMC-11 (b), NCI-H727 (c), and NCI-H720 (d) cells and treated with DMSO (vehicle control) and sulfatinib (0.25 and 2.5 µM). The red channel, corresponding to lung carcinoid cells, was omitted in the second column of each panel to highlight the tumor-induced microvascular network. Digital magnifications of the graft regions are shown in white boxes. At the bottom of each panel, the graph showed the quantification of tumor-induced angiogenesis in embryos implanted with lung carcinoid cells after 24 h of treatment with DMSO and sulfatinib (0.25 and 2.5 µM). Control (DMSO) values have been set to 1.0. Graphed values represent the mean ± S.E.M. * p < 0.05 vs. DMSO; ** p < 0.01 vs. DMSO; *** p < 0.001 vs. DMSO. Embryos are shown anterior to the left. Scale bar: 100 µm.

Effects of sulfatinib treatments on the invasiveness of lung carcinoid cells in grafted zebrafish embryos. Quantification of cell spread in the tail of embryos injected with NCI-H835 (a), UMC-11 (b), NCI-H727 (c), and NCI-H720 (d) cells at 48 hpi after 0.25 and 2.5 µM sulfatinib 48 h treatments. As an arbitrary unit of migration, we considered the number of fluorescent particles in the tail. DMSO values have been set to 1.0. Graphed values represent the mean ± S.E.M.

Acknowledgments
This image is the copyrighted work of the attributed author or publisher, and ZFIN has permission only to display this image to its users. Additional permissions should be obtained from the applicable author or publisher of the image. Full text @ Int. J. Mol. Sci.