IMAGE

Figure 2

ID
ZDB-IMAGE-220801-180
Source
Figures for Carra et al., 2022
Image
Figure Caption

Figure 2

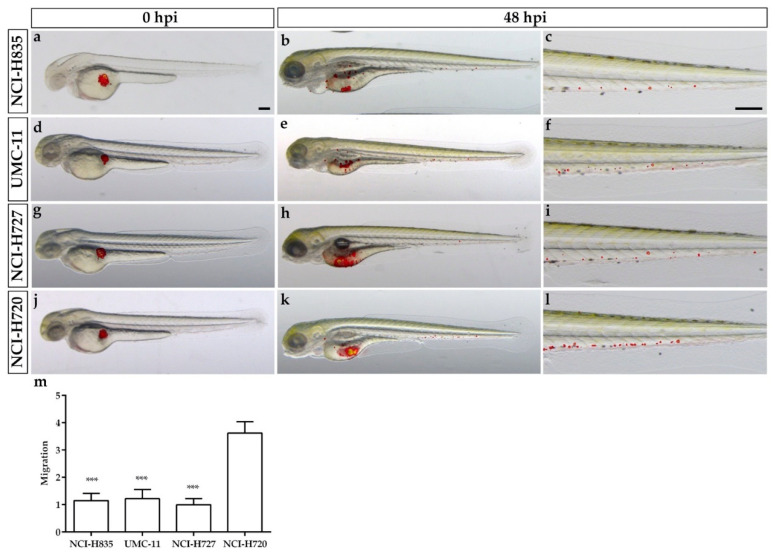
Lung carcinoid cell invasiveness in grafted zebrafish embryos. Overlay of representative fluorescent and bright field images of embryos grafted with red-stained NCI-H835, UMC-11, NCI-H727, and NCI-H720 cells at 0 (a,d,g,j) and 48 hpi (b,e,h,k), respectively. For each injected cell line, the tail, particularly at 48 hpi, was imaged (c,f,i,l). Images showed the spread of carcinoid cells throughout the embryo body. The graph showed the quantification of tumor cell migration in the tail of embryos implanted with lung carcinoid cells after 48 hpi (m). As an arbitrary unit of migration, we considered the number of fluorescent particles in the tail. NCI-H727 values have been set to 1.0. Graphed values represent the mean ± S.E.M. *** p < 0.001 vs. NCI-H720. Embryos are shown anterior to the left. Scale bar: 100 µm.

Acknowledgments
This image is the copyrighted work of the attributed author or publisher, and ZFIN has permission only to display this image to its users. Additional permissions should be obtained from the applicable author or publisher of the image. Full text @ Int. J. Mol. Sci.