IMAGE

Figure 6

ID
ZDB-IMAGE-220801-184
Source
Figures for Carra et al., 2022
Image
Figure Caption

Figure 6

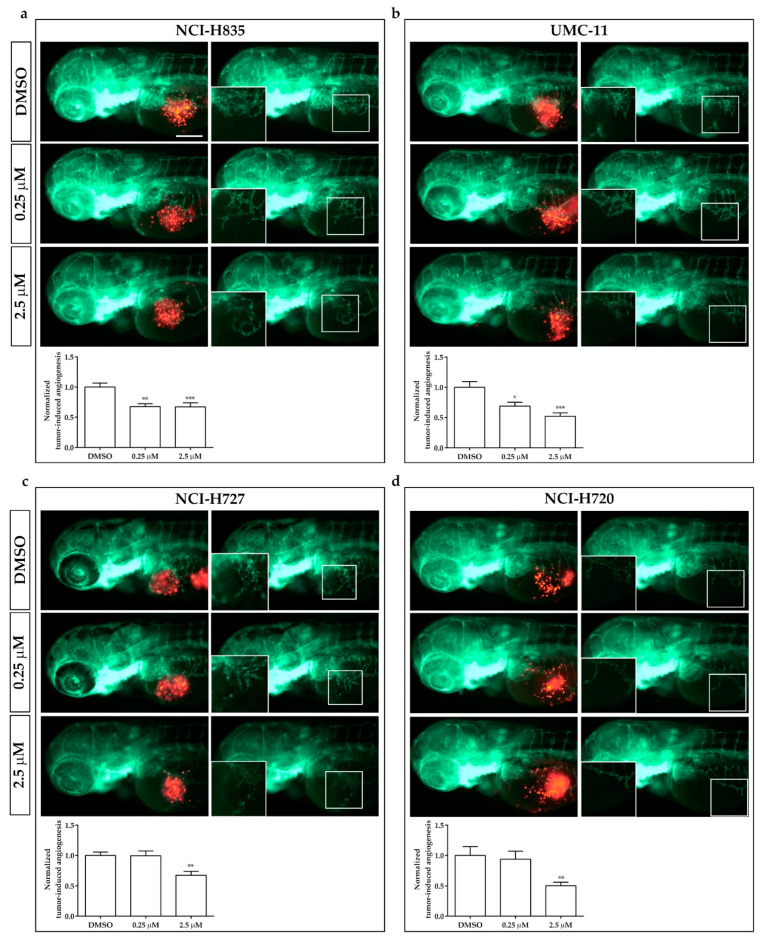
Effects of sulfatinib on tumor-induced angiogenesis in zebrafish embryos implanted with lung carcinoid cells. Representative epifluorescence images of Tg(fli1a:EGFP)y1 zebrafish embryos at 24 hpi, implanted with NCI-H835 (a), UMC-11 (b), NCI-H727 (c), and NCI-H720 (d) cells and treated with DMSO (vehicle control) and sulfatinib (0.25 and 2.5 µM). The red channel, corresponding to lung carcinoid cells, was omitted in the second column of each panel to highlight the tumor-induced microvascular network. Digital magnifications of the graft regions are shown in white boxes. At the bottom of each panel, the graph showed the quantification of tumor-induced angiogenesis in embryos implanted with lung carcinoid cells after 24 h of treatment with DMSO and sulfatinib (0.25 and 2.5 µM). Control (DMSO) values have been set to 1.0. Graphed values represent the mean ± S.E.M. * p < 0.05 vs. DMSO; ** p < 0.01 vs. DMSO; *** p < 0.001 vs. DMSO. Embryos are shown anterior to the left. Scale bar: 100 µm.

Acknowledgments
This image is the copyrighted work of the attributed author or publisher, and ZFIN has permission only to display this image to its users. Additional permissions should be obtained from the applicable author or publisher of the image. Full text @ Int. J. Mol. Sci.