FIGURE SUMMARY
Title

Evolutionary and Expression Analysis of MOV10 and MOV10L1 Reveals Their Origin, Duplication and Divergence

Authors
Yang, S., Zhang, X., Li, X., Yin, X., Teng, L., Ji, G., Li, H.
Source
Full text @ Int. J. Mol. Sci.

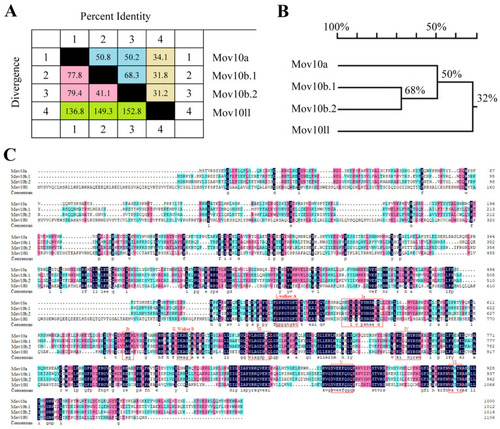
The protein sequences alignment of the Mov10s and Mov10l1 in zebrafish. (A) The percent identity and divergence of Mov10s and Mov10l1. The blue and pink areas, respectively, represent the percent identity and divergence between the three Mov10s, and the yellow and green areas show the percentage between either of Mov10s and Mov10l1. (B) The phylogenetic tree of Mov10s and Mov10l1. Numbers at each branches mean the percentage of their similarity. (C) The sequences alignment of Mov10s and Mov10l1. The dark blue area means 100% similarity; pale red, 75%; light blue, 50%; colorless, 0. The red boxes represents conserved sequences from previous studies.

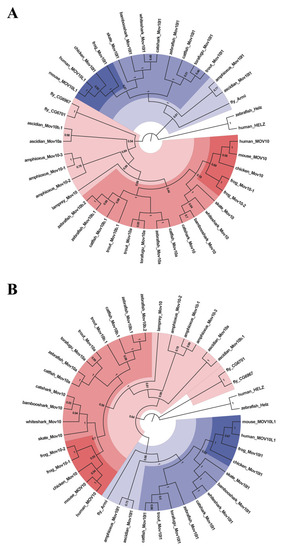
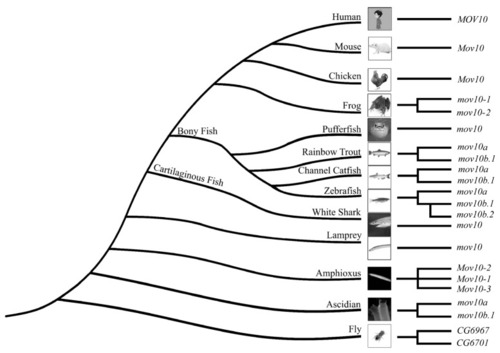
Phylogenetic tree analysis of the MOV10 and MOV10L1 in the selected species above. They are constructed by Maximum-Likelihood method (A) and Neighbor-Joining method (B). Different colored areas represent different evolutionary status, with darker colors indicating higher evolutionary status. Numbers at each branches mean the percentage of replicate trees in which the associated taxa clustered together in the bootstrap test (1000 replicates). Both trees are rooted with human and zebrafish helz.

The intron-exon structures of the mov10s and mov10l1 genes in zebrafish. The blue boxes denote the gene coding regions, the red boxes mean the untranslated region, and the lines represent the introns. The graduated line at the bottom shows the length of the genes.

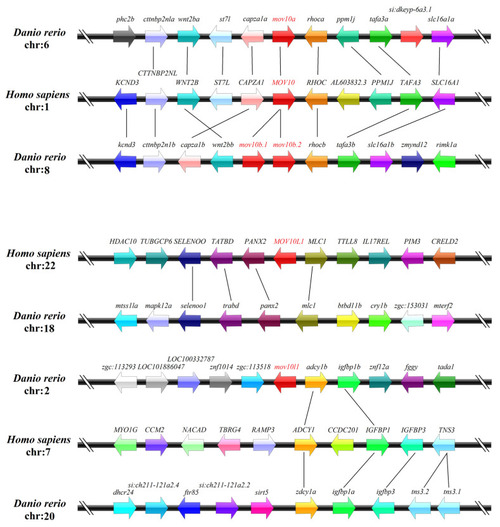
Synteny analyses of the
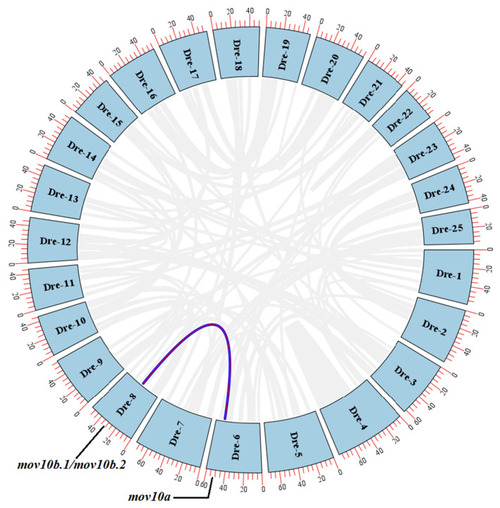
 MOV10 and MOV10L1 genes in human and zebrafish. The MOV10 and MOV10L1 genes are marked in red. The same color and the line between the genes of the two species mean they are homologous genes. The direction of the arrow represents the direction of the gene. The spatial distribution between different genes on the chromosome is indicated by bold black lines.

The circos plot of mov10s in zebrafish inter-chromosomal synteny analyses. The blue boxes represent the numbered zebrafish chromosomes. The outer red scales indicate the lengths of the chromosome sequences, with each scale representing 5 MB. The gray lines inside between the two chromosomes indicate the homologies between the genes, while the other colored lines indicated them between mov10s. Dre, Danio rerio.

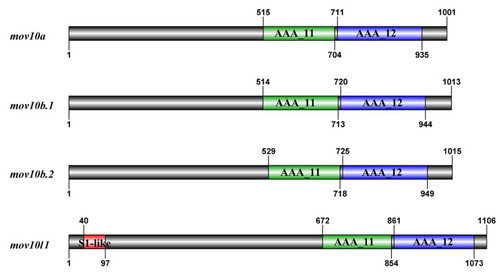
The schematic diagrams of domain organization in zebrafish Mov10s and Mov10l1. The bold black lines mean the amino acid sequence of the proteins. The higher squares represent the predicted domains of Mov10s and Mov10l1.

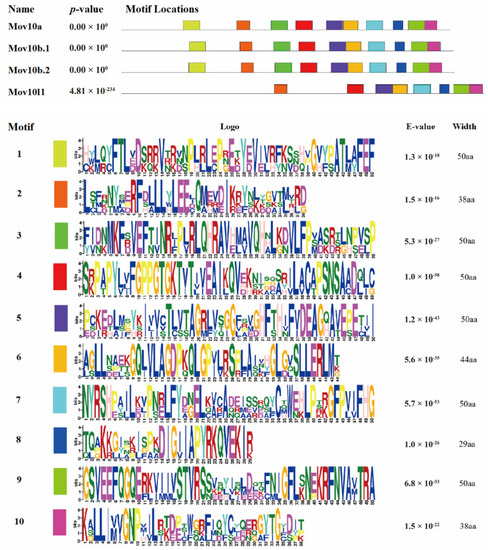
The schematic diagram of motifs of zebrafish Mov10s and Mov10l1 proteins. The motifs are arranged according to the position on the protein sequence, the letters in each motif are amino abbreviation. The size of the letter represents the saliency of the amino acid in the motif. The larger the letter, the higher the saliency, which is, the higher the frequency at which the amino acid appears in the same position in the same motif in different sequences.

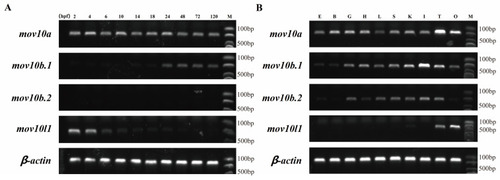
The Expression electrophoretogram of zebrafish mov10s and mov10l1 genes. The transcript expression level of each mov10s and mov10l1 gene was determined by RT-PCR in 10 embryonic development stages (A) and 10 tissues from six adult zebrafish (B). The number of PCR amplification cycles was 30. E, eye; B, brain; G, gills; H, heart; L, liver; S, spleen; K, kidney; I, intestine; T, testis; O, ovary; hpf: hour post fertilization; M, DNA Markers.

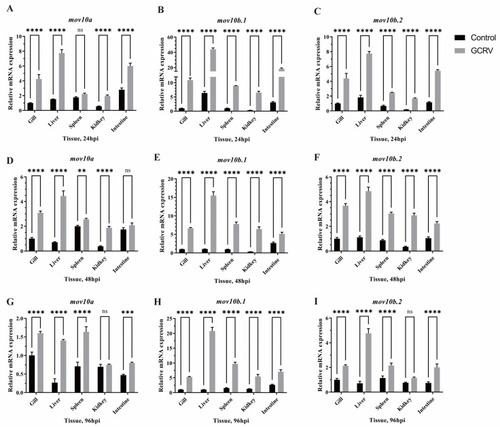
The antiviral properties of mov10s in various zebrafish tissues at different times upon virus infection. Compared to the control groups, the expression levels of mov10a, mov10b.1 and mov10b.2 at 24 hours (AC), 48 hours (DF), 96 hours (GI) after GCRV virus injection. ** means p < 0.01; *** means p < 0.001; **** means p < 0.0001; ns, not significant. hpi, hours post injection.

The lineage-specific intra-chromosomally duplications and tandem duplication of mov10 occurred among species.

Acknowledgments
This image is the copyrighted work of the attributed author or publisher, and ZFIN has permission only to display this image to its users. Additional permissions should be obtained from the applicable author or publisher of the image. Full text @ Int. J. Mol. Sci.