
Image
|
Figure Caption
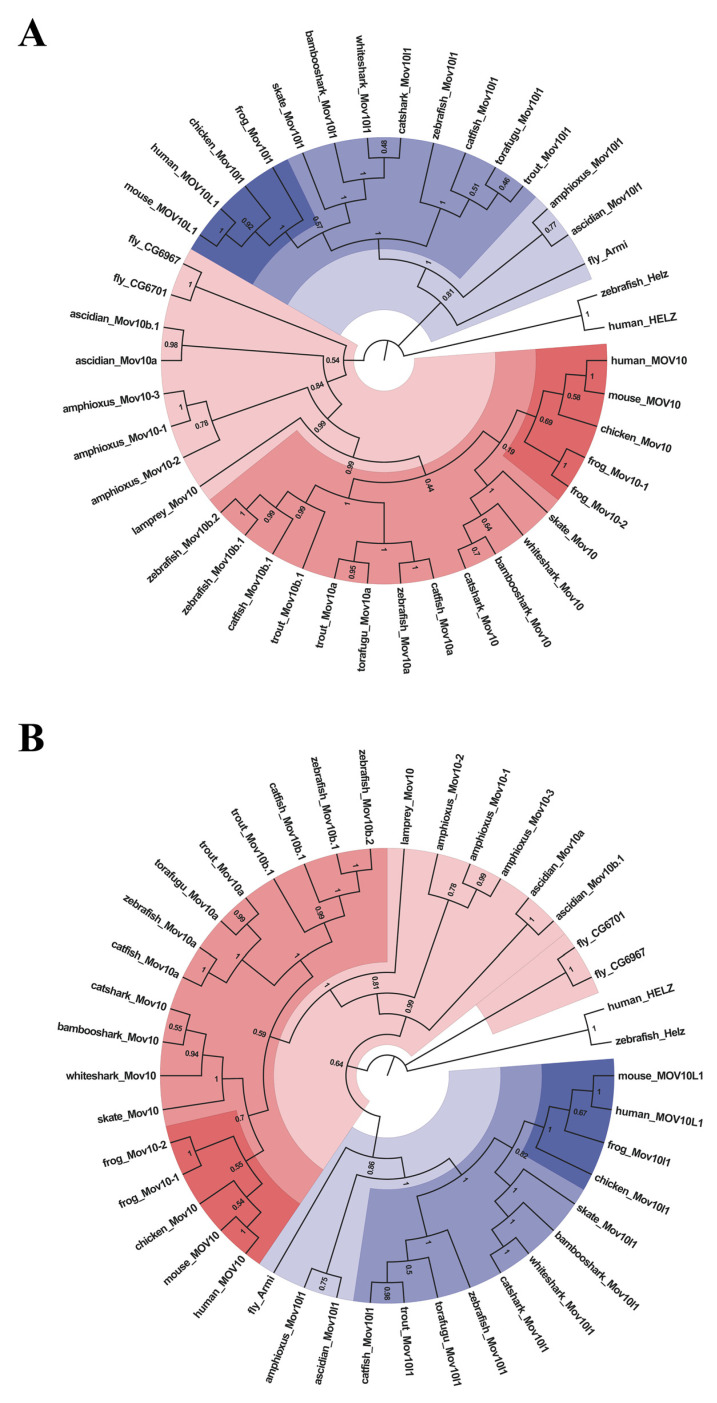
Figure 2
Phylogenetic tree analysis of the MOV10 and MOV10L1 in the selected species above. They are constructed by Maximum-Likelihood method (
Acknowledgments
This image is the copyrighted work of the attributed author or publisher, and
ZFIN has permission only to display this image to its users.
Additional permissions should be obtained from the applicable author or publisher of the image.
Full text @ Int. J. Mol. Sci.