IMAGE

Figure 1

ID
ZDB-IMAGE-220801-101
Source
Figures for Yang et al., 2022
Image
Figure Caption

Figure 1

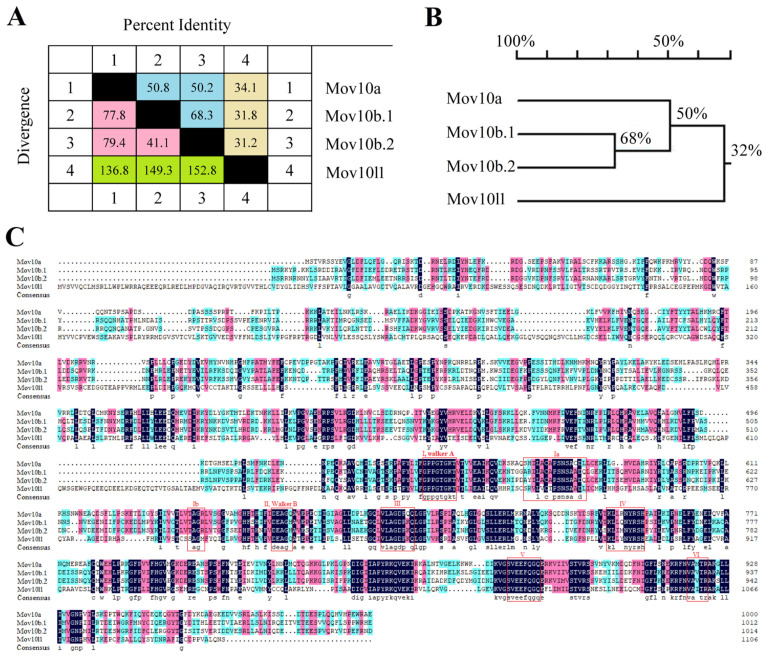
The protein sequences alignment of the Mov10s and Mov10l1 in zebrafish. (A) The percent identity and divergence of Mov10s and Mov10l1. The blue and pink areas, respectively, represent the percent identity and divergence between the three Mov10s, and the yellow and green areas show the percentage between either of Mov10s and Mov10l1. (B) The phylogenetic tree of Mov10s and Mov10l1. Numbers at each branches mean the percentage of their similarity. (C) The sequences alignment of Mov10s and Mov10l1. The dark blue area means 100% similarity; pale red, 75%; light blue, 50%; colorless, 0. The red boxes represents conserved sequences from previous studies.

Acknowledgments
This image is the copyrighted work of the attributed author or publisher, and ZFIN has permission only to display this image to its users. Additional permissions should be obtained from the applicable author or publisher of the image. Full text @ Int. J. Mol. Sci.