
FIGURE
Figure 6
- ID
- ZDB-FIG-220801-104
- Publication
- Yang et al., 2022 - Evolutionary and Expression Analysis of MOV10 and MOV10L1 Reveals Their Origin, Duplication and Divergence
- Other Figures
- All Figure Page
- Back to All Figure Page
Figure 6
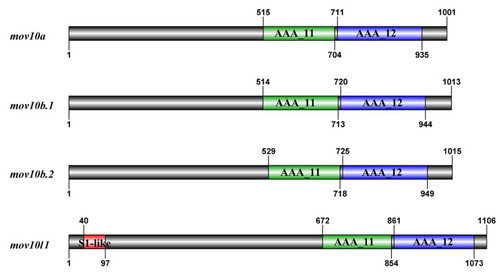
The schematic diagrams of domain organization in zebrafish Mov10s and Mov10l1. The bold black lines mean the amino acid sequence of the proteins. The higher squares represent the predicted domains of Mov10s and Mov10l1. |
Expression Data
Expression Detail
Antibody Labeling
Phenotype Data
Phenotype Detail
Acknowledgments
This image is the copyrighted work of the attributed author or publisher, and
ZFIN has permission only to display this image to its users.
Additional permissions should be obtained from the applicable author or publisher of the image.
Full text @ Int. J. Mol. Sci.