
- Title
-
Bridging Size and Charge Effects of Mesoporous Silica Nanoparticles for Crossing the Blood-Brain Barrier
- Authors
- Chen, Y.P., Chou, C.M., Chang, T.Y., Ting, H., Dembélé, J., Chu, Y.T., Liu, T.P., Changou, C.A., Liu, C.W., Chen, C.T.
- Source
- Full text @ Front Chem
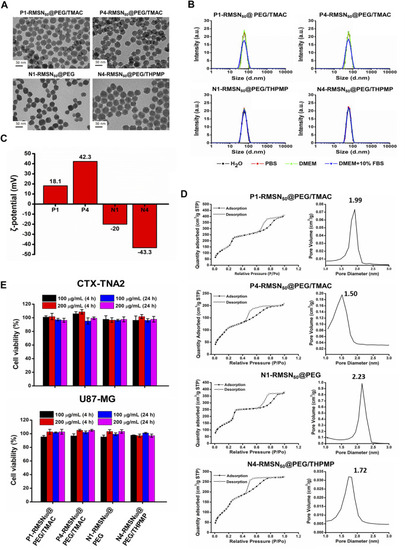
Physical characterizations and cytotoxicity of four types of RITC-conjugated mesoporous silica nanoparticles (RMSNs). (A) TEM images. Scale bar = 50 nm. (B) DLS, (C) zeta potential, and (D) nitrogen adsorption/desorption isotherms and corresponding pore size distribution plot of various types of RMSNs. (E) Cytotoxicity assay. CTX-TNA2 and U87-MG cells were cultured with different concentrations (100 and 200 μg/ml) of various types of RMSNs for 4 and 24 h in 10% serum-containing medium. Cell viability was detected using an MTT assay. |
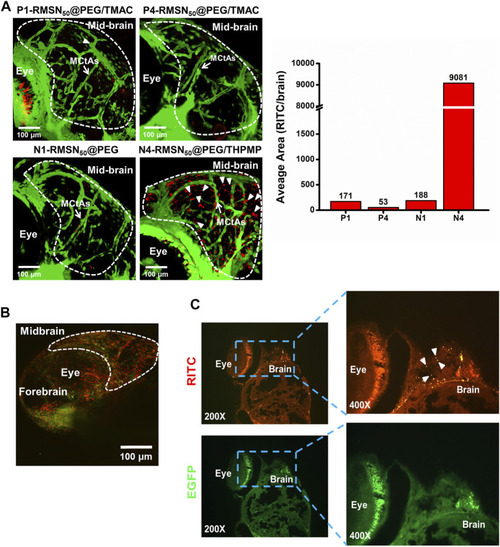
Biodistribution in the brain of four types of RITC-conjugated mesoporous silica nanoparticles (RMSNs) after a pericardial cavity injection in Tg(zfli1:EGFP transgenic zebrafish (200–300 ng/embryo) at 4 days post-fertilization (dpf). (A) Confocal microscopy imaged the distributions of various types of RMSNs in the zebrafish larval brain. The white arrow indicates mesencephalic central arteries (MCtAs). Arrowheads indicate that RMSNs (red) were outside the brain’s blood vessels (green). (B) Two-photon microscopic images and (C) fluorescence microscopic analysis of zebrafish embryo brains after injection with N4-RMSN50@PEG/THPMP. Red (RITC) fluorescence and green (GFP) fluorescence, respectively, represent RMSNs and blood vessels. Arrowheads indicated RMSNs (red). |
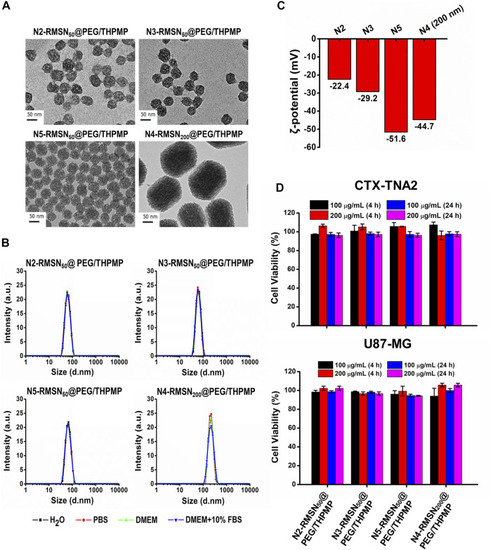
Physical characterizations and cytotoxicity of four different negatively charged RITC-conjugated mesoporous silica nanoparticles (RMSNs) with different sizes (50 and 200 nm). (A) TEM images. Scale bar = 50 nm. (B) DLS and (C) zeta potential measurements. (D) Cytotoxicity assay. CTX-TNA2 and U87-MG cells were cultured with different concentrations (100 and 200 μg/ml) of various types of RMSNs for 4 and 24 h under 10% serum-containing media condition. Cell viability was detected with an MTT assay. |
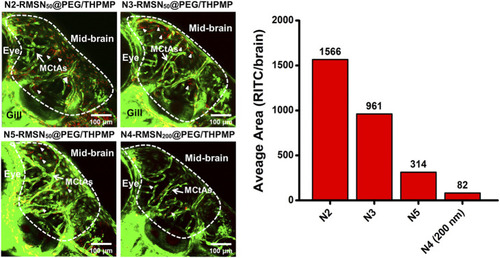
Confocal microscopic images of four different negatively charged RITC-conjugated mesoporous silica nanoparticles (RMSNs) with different sizes (50 and 200 nm) in zebrafish larval midbrain. White arrows indicate mesencephalic central arteries (MCtAs); arrowheads indicated red fluorescence (RITC) of nanoparticles outside the brain’s blood vessels (GFP, green). |

N4-MSN50@PEG/THPMP-mediated doxorubicin (Dox) delivery against the U87-MG cells and their stability. (A) Schematic representation of Dox loading strategy and the loading capacity. Stability assay of N4-MSN50@PEG/THPMP/Dox by using (B) hydrodynamic diameter distributions and (C) zeta potential measurements in water at day 1, 8, and 15. (D) In vitro release profiles of Dox in PBS buffer (pH 7.4 and 5.5) at a physiological temperature (37°C). (E) In vitro cytotoxicity of U87-MG cells treated with different concentrations of free Dox or Dox-loaded N4-MSN50@PEG/THPMP (equivalent dose of Dox) for 24 h ***p < 0.001. |

N4-RMSN50@PEG/THPMP decreased doxorubicin (Dox) induced toxicity and increased the survival rate. (A) Representative optical images of zebrafish at 24 hpf stage after exposure to Dox (0.25 and 0.5 mg/ml), N4-MSN50@PEG/THPMP (4.5 and 9 mg/ml), and N4-MSN50@PEG/THPMP/Dox (4.5 and 9 mg/ml) at an equivalent dose of Dox for 24, 48, 72, and 96 hpf. (B) Kaplan–Meier plots of overall survival. N = 20 (magnification ×50). |

Comprehensive protein corona identification of N4-RMSN50@PEG/THPMP incubated with mouse serum by LC-Ms/MS. (A) SDS-PAGE gel of plasma (control) and corona proteins associated with N4-RMSN50@PEG/THPMP. (B) Classification of corona protein according to (C) molecular weight. and (D) isoelectric point. The most abundant proteins (top 20) are summarized. (E) Heatmap of the most abundant proteins. (F) Venn diagrams report the number of protein corona and the proteins related to BBB transport. (G) Relative abundance (vs mean abundance) of BBB transport associated proteins identified in the protein corona. C: control. N4: N4-RMSN50@PEG/THPMP. |
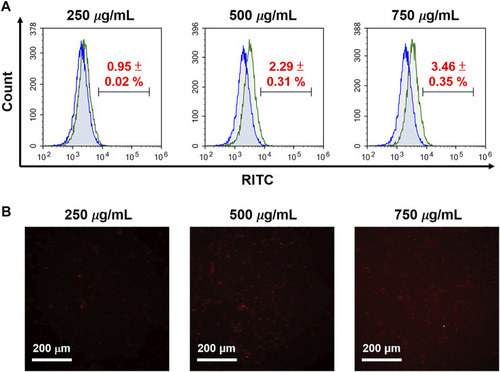
Evaluation of RITC-conjugated N4-MSN50@PEG/THPMP for cell uptake. U87-MG cells treated with different concentrations of N4-RMSN50@PEG/THPMP (250, 500, and 750 μg/ml) for 24 h. (A) Flow cytometry analysis and (B) fluorescence microscopy imaging for cell uptake in 10% serum-containing medium. Scale bars: 200 μm. |