FIGURE SUMMARY
Title

Optogenetic control of YAP cellular localisation and function

Authors
Toh, P.J.Y., Lai, J.K.H., Hermann, A., Destaing, O., Sheetz, M.P., Sudol, M., Saunders, T.E.
Source
Full text @ EMBO Rep.

  • A. Schematic of optoYAP construct. OptoYAP is folded in the dark due to the interaction between LOV2 domain and Jα helix. Under 488 nm light, nuclear localisation signal (NLS) is exposed and optoYAP is transported into the nucleus. Activation protocol was performed with 1 s blue light pulse every 30 s (blue bars), and cells were imaged every minute (red bars) for 20 min.
  • B. Representative images of mCherry-optoYAP in HEK293T cells imaged with only 561 nm laser following the protocol in (A). Scale bars, 10 μm.
  • B′. Fold-change in nuclear localisation of mCherry-optoYAP (n = 50 cells from three independent experiments).
  • C. Representative images of the same cells in (B) exposed to both 488 and 561 nm following the protocol shown in (A). Scale bars, 10 μm.
  • C′. Fold-change in nuclear localisation of the mCherry-optoYAP (n = 50 cells from three independent experiments).
  • D. HEK293T cells transfected with optoYAP were subjected to three cycles of activation protocol and recovery in the dark. (Top) The ratio of mCherry-optoYAP signal in the nucleus to the cytoplasmic mCherry-optoYAP signal (n = 8 cells from two independent experiments). (Bottom) Representative images of the mCherry-optoYAP signal from the same HEK293T cells at each cycle. Scale bars, 10 μm.
  • E. Activation time constant (τa) and recovery time constant (τr) (see Materials and Methods and Fig EV1B and C) of optoYAP in HEK293T cells. Vertical dashed line represents time when 488 nm stimulation ceased. Red line indicates average nuclear/cytoplasmic ratio (n = 12 cells).
  • F. HEK293T cells transfected with optoYAP subjected to 0.065, 0.163 and 0.325 mW 488 nm laser power at the focal plane. N = 3 cells per laser power.

Figure 2. Light activation of optoYAP can activate downstream YAP target genes and control cell proliferation

  • A. Expression levels of ANKRD1, CTGF, and CYR61 transcripts in HEK293T cells transfected with optoYAP after 48 h of activation protocol. Gene expression level was normalised to the housekeeping gene, EIF1B. Horizontal bars represent mean and 95% confidence interval from six biological replicates across two independent experiments for each condition, ***P < 10−3 (unpaired t-test).
  • B, C. Cell proliferation assay. HEK293T (B) and HFF (C) cells were transfected with optoYAP and subjected to activation protocol as described in Fig 1A or kept in the dark for 1 week. Error bars are s.d., n = 3 independent experiments for each condition, **P < 10−2 (unpaired t-test).

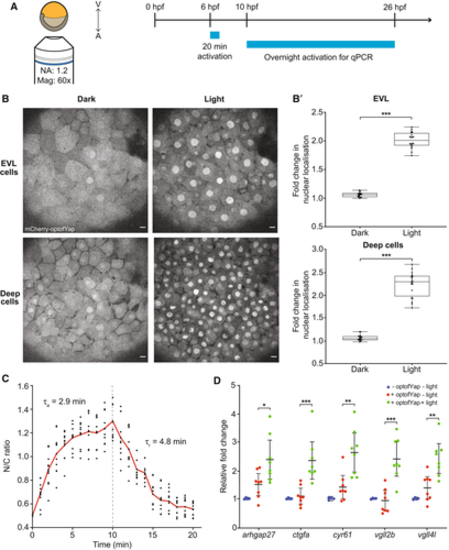
Figure 3. Validation of optofYap in zebrafish

  • A. Imaging and light activation protocol in zebrafish. Shield-stage embryos were subjected to activation protocol as described in Fig 1A and imaged at the animal pole.
  • B. Example images of embryos expressing optofYap (mCherry-tagged) in the EVL and deep cells kept in the dark or subjected to the activation protocol at 6 hpf. Scale bars, 10 μm.
  • B′. Fold-change in nuclear localisation of mCherry-optofYap (n = 20 cells from three independent experiments). Box plots represent median and 25th to 75th percentiles. Whiskers show minimum and maximum points. ***P < 10−3 (paired t-test).
  • C. The N/C ratio measured using mCherry signal in zebrafish embryos injected with optofYap tracked over 10 min of activation protocol and 10 min recovery in the dark (see also Fig EV3A and B) (n = 10 cells from two independent experiments, red line = average). Vertical dashed line represents time when 488 nm stimulation ceased.
  • D. qPCR of Yap target genes. Embryos were kept in the dark until 10 hpf and then subjected to pulsed light activation for 16 h. Gene expression level was normalised to the housekeeping gene, rpl13. Horizontal bars represent mean and 95% confidence interval from four biological replicates for control and eight biological replicates for injected samples, *P < 0.05, **P < 10−2, ***P < 10−3 (unpaired t-test).

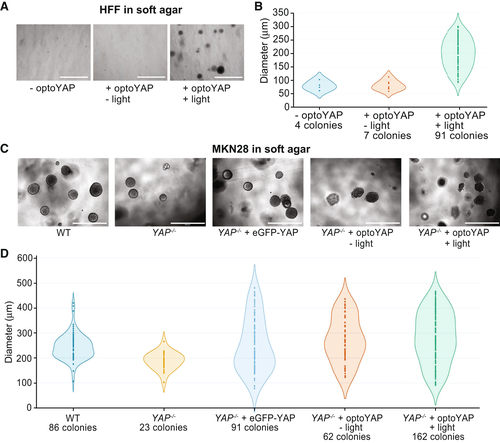
Figure 4. Functional assays of optoYAP in tissue culture cells

  • A–D. Soft agar colony formation assay for HFF (A, B) and MKN28 (C, D) cells respectively grown on soft agar for 1 week under different light conditions as described in Fig 1A. Scale bars, 1 mm. (A, C) Representative images of colony growth in HFF and MKN28 cells, respectively, under different activation conditions. (B, D) Diameter of individual colonies formed under different light conditions and genetic backgrounds. Colonies were counted and measured from three biological replicates.

Acknowledgments
This image is the copyrighted work of the attributed author or publisher, and ZFIN has permission only to display this image to its users. Additional permissions should be obtained from the applicable author or publisher of the image. Full text @ EMBO Rep.