IMAGE

Fig. 4

ID
ZDB-IMAGE-220906-15
Source
Figures for Toh et al., 2022
Image
Figure Caption

Fig. 4

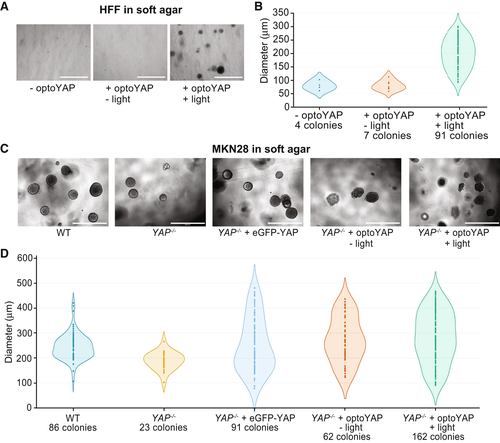
Figure 4. Functional assays of optoYAP in tissue culture cells

  • A–D. Soft agar colony formation assay for HFF (A, B) and MKN28 (C, D) cells respectively grown on soft agar for 1 week under different light conditions as described in Fig 1A. Scale bars, 1 mm. (A, C) Representative images of colony growth in HFF and MKN28 cells, respectively, under different activation conditions. (B, D) Diameter of individual colonies formed under different light conditions and genetic backgrounds. Colonies were counted and measured from three biological replicates.

Acknowledgments
This image is the copyrighted work of the attributed author or publisher, and ZFIN has permission only to display this image to its users. Additional permissions should be obtained from the applicable author or publisher of the image. Full text @ EMBO Rep.