IMAGE

Fig. 3

ID
ZDB-IMAGE-220906-14
Source
Figures for Toh et al., 2022
Image
Figure Caption

Fig. 3

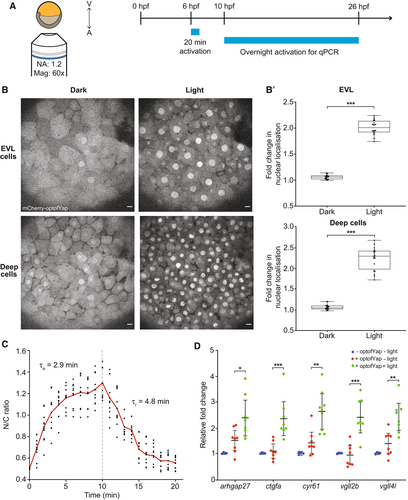
Figure 3. Validation of optofYap in zebrafish

  • A. Imaging and light activation protocol in zebrafish. Shield-stage embryos were subjected to activation protocol as described in Fig 1A and imaged at the animal pole.
  • B. Example images of embryos expressing optofYap (mCherry-tagged) in the EVL and deep cells kept in the dark or subjected to the activation protocol at 6 hpf. Scale bars, 10 μm.
  • B′. Fold-change in nuclear localisation of mCherry-optofYap (n = 20 cells from three independent experiments). Box plots represent median and 25th to 75th percentiles. Whiskers show minimum and maximum points. ***P < 10−3 (paired t-test).
  • C. The N/C ratio measured using mCherry signal in zebrafish embryos injected with optofYap tracked over 10 min of activation protocol and 10 min recovery in the dark (see also Fig EV3A and B) (n = 10 cells from two independent experiments, red line = average). Vertical dashed line represents time when 488 nm stimulation ceased.
  • D. qPCR of Yap target genes. Embryos were kept in the dark until 10 hpf and then subjected to pulsed light activation for 16 h. Gene expression level was normalised to the housekeeping gene, rpl13. Horizontal bars represent mean and 95% confidence interval from four biological replicates for control and eight biological replicates for injected samples, *P < 0.05, **P < 10−2, ***P < 10−3 (unpaired t-test).

Acknowledgments
This image is the copyrighted work of the attributed author or publisher, and ZFIN has permission only to display this image to its users. Additional permissions should be obtained from the applicable author or publisher of the image. Full text @ EMBO Rep.