- Title
-
TFAP2B Haploinsufficiency Impacts Gastrointestinal Function and Leads to Pediatric Intestinal Pseudo-obstruction
- Authors
- Zada, A., Kuil, L.E., de Graaf, B.M., Kakiailatu, N., Windster, J.D., Brooks, A.S., van Slegtenhorst, M., de Koning, B., Wijnen, R.M.H., Melotte, V., Hofstra, R.M.W., Brosens, E., Alves, M.M.
- Source
- Full text @ Front Cell Dev Biol
|
(Continued). |
|
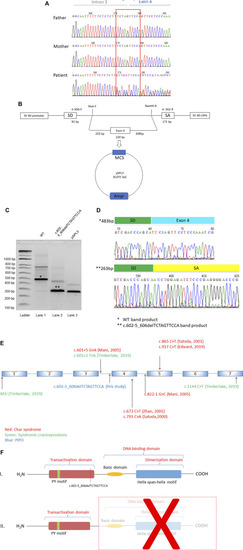
TFAP2B transcript and protein expression analysis. (A) qRT-PCR analysis of TFAP2B transcript levels of WT, c.706 C > T, c.898 C > T, c.1144 C > T, and exon 4 deletion expression constructs show no statistically significant difference among the samples normalized to GAPDH and b-Actin. (B) Western blot analysis of all tested variants shows absence of protein products for the syndromic craniosynostosis variant (c.1144 C > T) and PIPO variant (del Exon 4). Protein products are still detectable for the Char syndrome variants (c.706 C > T and c.898 C > T). A Myc-tag antibody was used to visualize TFAP2B protein levels. |
|
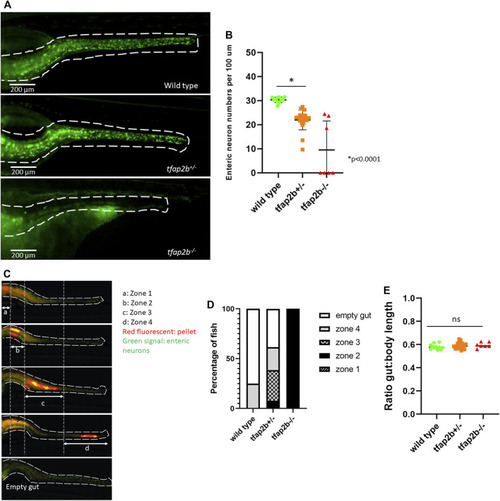
Decreased enteric neuronal numbers and delayed intestinal transit time in tfap2b +/− zebrafish. (A) Image of the zebrafish wild type, tfap2b +/− and tfap2 −/− intestine. Enteric neurons are shown in green and a white dash line delineates the intestine. (B) A significant reduced number of enteric neurons (*p < 0.0001, unpaired t-test) was found in the tfap2b +/− fish (n = 20) when compared to the wild type fish (n = 11). Neurons were counted and presented per 100 µm. Four out of 7 tfap2b −/− fish showed total aganglionosis. (C) Intestinal transit time was determined by the presence of a fluorescent pellet (red fluorescent) in the intestine 16 h after food intake (final measurement). To help evaluation, the zebrafish intestine was divided in 4 zones, proximal to distal, and empty. Only fish with fluorescent pellet in zone 1 at time 0 (initial measurement), were selected for this study. (D) A significant delay in intestinal transit time was observed in tfap2b +/− fish, as 75% of wild type fish had an empty intestine 16 h after food intake, in comparison with only 38.4% of tfap2b +/− fish (p < 0.0001, Proportion test). All tfap2b −/− fish had pellet retained in zone 2. (E) No difference in the ratio total body length to mouth-distal intestinal length was identified for wild type, tfap2b+/− and tfap2b−/− fish. |
|
Expression levels of tfap2b and ednrbb during zebrafish development. (A) Expression levels of tfap2b in crispant fish at 8 hpf, 1, 2, 3, 4, and 5 dpf show a significant decrease when compared to wild type, starting from 1 dpf onwards (p < 0.05, unpaired t-test). (B) Expression levels of ednrbb in tfap2b crispants show a significant decrease when compared to wild type fish, at 4 and 5 dpf (p < 0.05, unpaired t-test). EXPRESSION / LABELING:
|
|
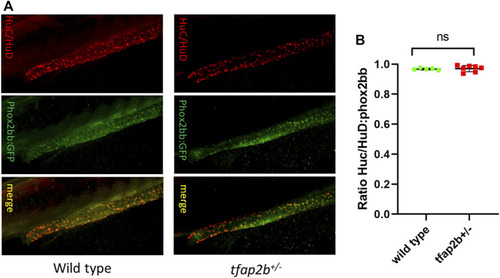
Differentiated enteric neurons in tfap2b +/− fish. (A) Confocal microscope images of HuC/HuD and phox2bb:GFP positive cells in wild type and tfap2b +/− F2 fish. (B) No significant difference in the ratio of HuC/HuD and phox2bb:GFP positive cells in wild type and tfap2b +/− F2 fish was found (p > 0.05, unpaired t-test). |


