
Fig. 3
- ID
- ZDB-IMAGE-220726-82
- Genes
- Publication
- Zada et al., 2022 - TFAP2B Haploinsufficiency Impacts Gastrointestinal Function and Leads to Pediatric Intestinal Pseudo-obstruction
- All Figures
- Figures for Zada et al., 2022
|
Fig. 3
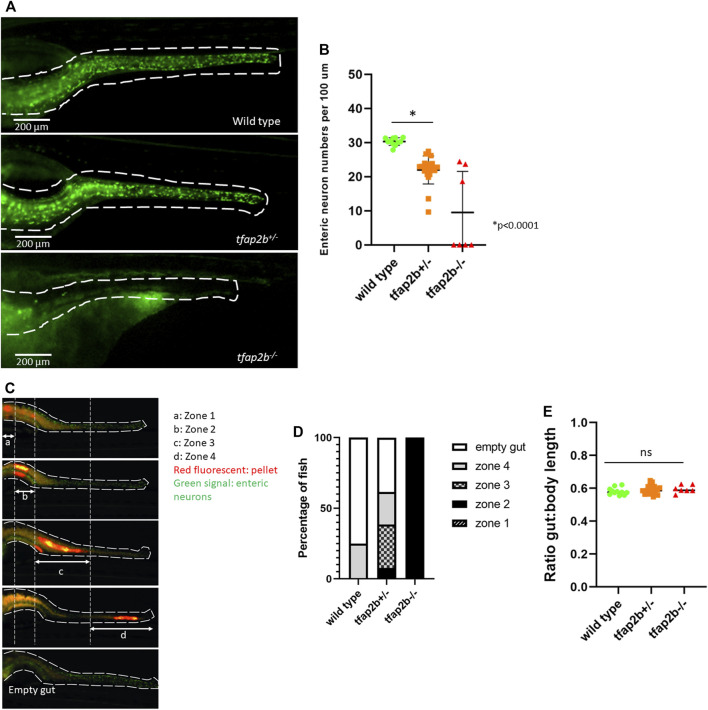
Decreased enteric neuronal numbers and delayed intestinal transit time in tfap2b +/− zebrafish. (A) Image of the zebrafish wild type, tfap2b +/− and tfap2 −/− intestine. Enteric neurons are shown in green and a white dash line delineates the intestine. (B) A significant reduced number of enteric neurons (*p < 0.0001, unpaired t-test) was found in the tfap2b +/− fish (n = 20) when compared to the wild type fish (n = 11). Neurons were counted and presented per 100 µm. Four out of 7 tfap2b −/− fish showed total aganglionosis. (C) Intestinal transit time was determined by the presence of a fluorescent pellet (red fluorescent) in the intestine 16 h after food intake (final measurement). To help evaluation, the zebrafish intestine was divided in 4 zones, proximal to distal, and empty. Only fish with fluorescent pellet in zone 1 at time 0 (initial measurement), were selected for this study. (D) A significant delay in intestinal transit time was observed in tfap2b +/− fish, as 75% of wild type fish had an empty intestine 16 h after food intake, in comparison with only 38.4% of tfap2b +/− fish (p < 0.0001, Proportion test). All tfap2b −/− fish had pellet retained in zone 2. (E) No difference in the ratio total body length to mouth-distal intestinal length was identified for wild type, tfap2b+/− and tfap2b−/− fish.