
- Title
-
Investigation Driven by Network Pharmacology on Potential Components and Mechanism of DGS, a Natural Vasoprotective Combination, for the Phytotherapy of Coronary Artery Disease
- Authors
- Zhang, Y.G., Liu, X.X., Zong, J.C., Zhang, Y.T., Dong, R., Wang, N., Ma, Z.H., Li, L., Wang, S.L., Mu, Y.L., Wang, S.S., Liu, Z.M., Han, L.W.
- Source
- Full text @ Molecules
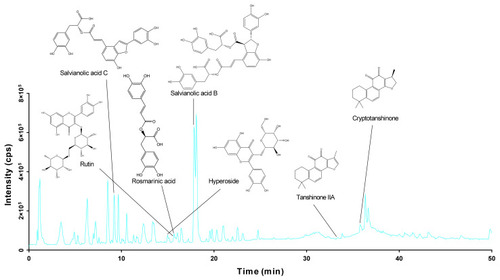
The HPLC-QTOF/MS total ion chromatogram of DGS in the negative ion modes. |
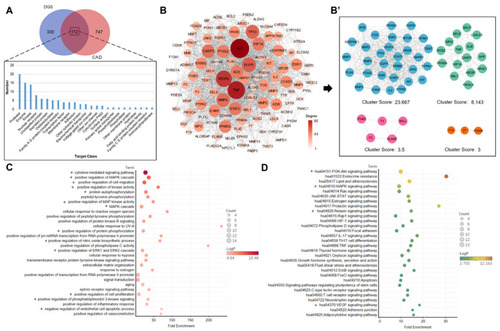
Network pharmacology analysis: (A) The Venn diagram analysis for DGS and HCD targets. (B) PPI network of the DGS compounds targets against CAD. (B’) MCODE analysis of PPI network. (C) Biological process analysis of PPI networks with a clustering score of 23.667. * Represents a potentially important biological process. (D) KEGG enrichment analysis of PPI networks with a clustering score of 23.667. * Represents a potentially important signaling pathway. |
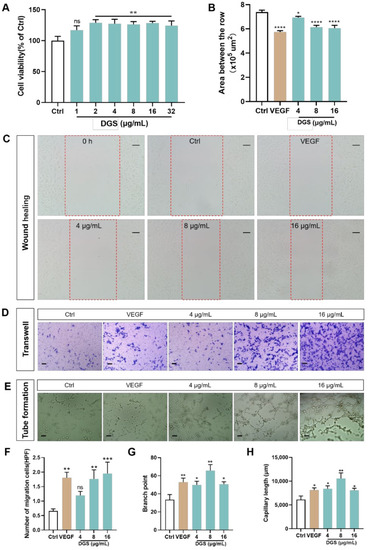
Effect of DGS on HUVECs cells in vitro: (A) An CCK-8 assay was carried out to measure HUVECs viability. (B) Effect of different concentrations of DGS on the migration of HUVECs cells. Results are presented as the mean ± SEM. (C) The healing area of the wound at 0 and 24 h were photographed by microscopy. The red dashed box represents the area counted after migration. Scale bar: 100 μm. (D) The migration of HUVECs in Transwell migration assays. Scale bar: 100 μm. (E) DGS promoted tube formation of HUVECs. Scale bar: 100 μm. (F) Quantification of the number of migrated cells. (G) Quantitative analysis of branch points for tube formation assays. (H) Quantitative analysis of capillary length for tube formation assays. Values are expressed as the mean ± SEM. ns p < 0.05 vs. Control, * p < 0.05 vs. Control, ** p < 0.01 vs. Control, *** p < 0.001 vs. Control, **** p < 0.0001 vs. Control. |
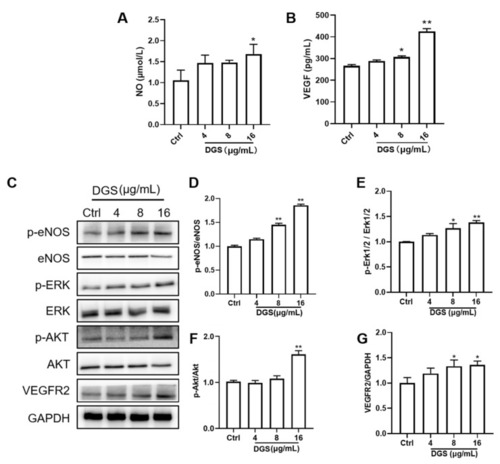
Regulation of NO, VEGF, and related proteins by DGS: (A) Effect of DGS on NO levels. (B) Effect of DGS on VEGFA levels. (C) Western blot results. (D–G) are the results of statistical analysis of VEGFR2/GAPDH, p-Akt/Akt, p-Erk1/2/Erk1/2, and p-eNOS/eNOS, respectively. Data are presented as the mean ± SEM from at least three independent experiments. * p < 0.05 vs. Control, ** p < 0.01 vs. Control. |
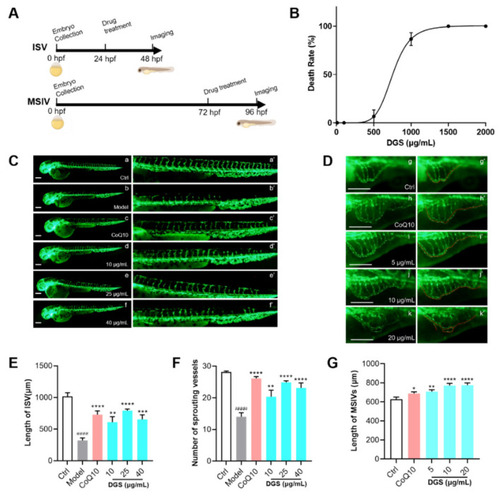
DGS promoted the angiogenesis of zebrafish: (A) Schematic diagram of the zebrafish experiment. (B) The lethal curve of DGS (C) Fluorescent images of the ISV of the zebrafish. The images of a’–f’ were partial enlargements of images a–f. Scale bar: 200 μm. (D) Fluorescent image of the MSIV of the zebrafish. The images of g’–k’ were partial enlargements of images g–k. Scale bar: 200 μm. (E) Effect of DGS on the length of ISV in zebrafish. (F) The effect of DGS on the sprouting of SIV in zebrafish. (G) Effect of DGS on the growth of the MSIV in zebrafish. Values are expressed as the mean ± SEM (n = 10). #### p < 0.0001 vs. Control, * p < 0.05 vs. Model, ** p < 0.01 vs. Control, *** p < 0.01 vs. Control, **** p < 0.0001 vs. Control. |
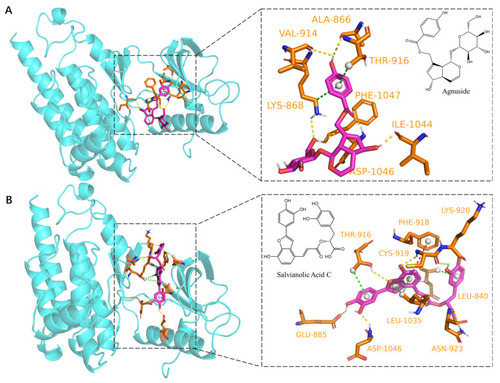
Molecular docking of Agnuside and Salvianolic Acid C to VEGFR2 protein: (A) Agnuside binding model with VEGFR2, yellow dashed lines represent hydrogen bonding interactions, green dashed lines represent π–Sigma interactions. (B) Salvianolic Acid C binding model with VEGFR2, yellow dashed lines represent hydrogen bonding interactions, green dashed lines represent π–Sigma interactions and red dashed lines represent π–π stacked interactions. |
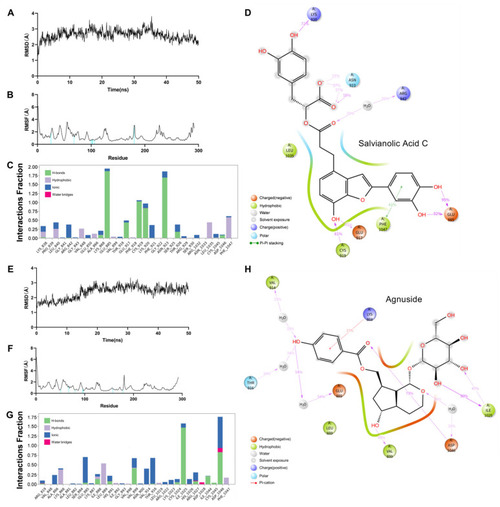
Dynamics molecular docking of two protein–ligand complexes, Salvianolic Acid C–VEGFR2 (A–D) and Agnuside–VEGFR2 (E–H): (A) RMSD of Salvianolic Acid C–VEGFR2. (B) RMSF of Salvianolic Acid C–VEGFR2. (C) Protein–Ligand Contacts Diagram of Salvianolic Acid C–VEGFR2; Y axis suggests that percentage of the simulation time the specific interaction is maintained; Values over 1.0 are possible as some protein residue may make multiple contacts of the same subtype with the ligand. (D) A schematic of detailed Salvianolic Acid C atom interactions with the VEGFR2 residues. (E) RMSD of Agnuside–VEGFR2. (F) RMSF of Agnuside–VEGFR2. (G) Protein–Ligand Contacts Diagram of Agnuside–VEGFR2. (H) A schematic of detailed Agnuside atom interactions with the VEGFR2 residues. |
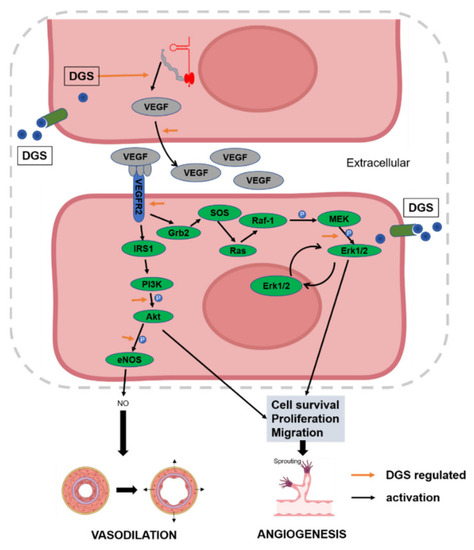
DGS participates in the overall regulatory network of CAD inhibition through angiogenesis and vasodilation. |