
|
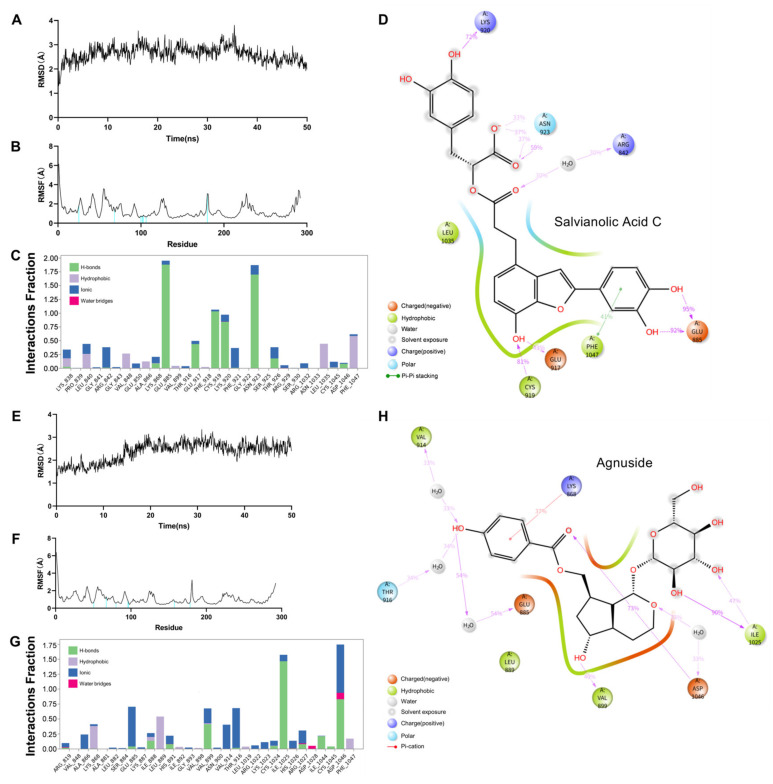
Fig. 7
Dynamics molecular docking of two protein–ligand complexes, Salvianolic Acid C–VEGFR2 (A–D) and Agnuside–VEGFR2 (E–H): (A) RMSD of Salvianolic Acid C–VEGFR2. (B) RMSF of Salvianolic Acid C–VEGFR2. (C) Protein–Ligand Contacts Diagram of Salvianolic Acid C–VEGFR2; Y axis suggests that percentage of the simulation time the specific interaction is maintained; Values over 1.0 are possible as some protein residue may make multiple contacts of the same subtype with the ligand. (D) A schematic of detailed Salvianolic Acid C atom interactions with the VEGFR2 residues. (E) RMSD of Agnuside–VEGFR2. (F) RMSF of Agnuside–VEGFR2. (G) Protein–Ligand Contacts Diagram of Agnuside–VEGFR2. (H) A schematic of detailed Agnuside atom interactions with the VEGFR2 residues.