
Fig. 5
- ID
- ZDB-FIG-220713-37
- Publication
- Zhang et al., 2022 - Investigation Driven by Network Pharmacology on Potential Components and Mechanism of DGS, a Natural Vasoprotective Combination, for the Phytotherapy of Coronary Artery Disease
- Other Figures
- All Figure Page
- Back to All Figure Page
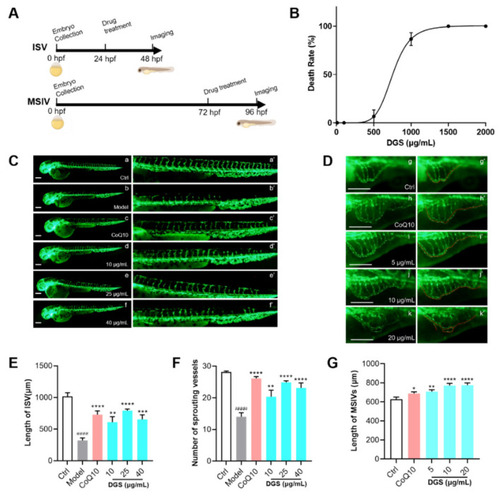
DGS promoted the angiogenesis of zebrafish: (A) Schematic diagram of the zebrafish experiment. (B) The lethal curve of DGS (C) Fluorescent images of the ISV of the zebrafish. The images of a’–f’ were partial enlargements of images a–f. Scale bar: 200 μm. (D) Fluorescent image of the MSIV of the zebrafish. The images of g’–k’ were partial enlargements of images g–k. Scale bar: 200 μm. (E) Effect of DGS on the length of ISV in zebrafish. (F) The effect of DGS on the sprouting of SIV in zebrafish. (G) Effect of DGS on the growth of the MSIV in zebrafish. Values are expressed as the mean ± SEM (n = 10). #### p < 0.0001 vs. Control, * p < 0.05 vs. Model, ** p < 0.01 vs. Control, *** p < 0.01 vs. Control, **** p < 0.0001 vs. Control. |