
- Title
-
Induction of endoplasmic reticulum stress markers in an acromegaly model
- Authors
- Elbialy, A., Sulidan, K., Bhuiyan, A., Igarashi, Y., Yoshitake, K., Yamanouchi, D., Kang, J., Asakawa, S., Watabe, S., Kinoshita, S.
- Source
- Full text @ J. Cell. Biochem.
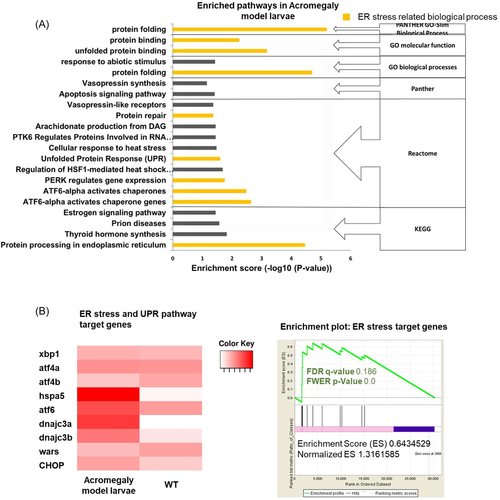
Induction of ER stress in acromegaly zebrafish larvae. (A) Histogram of all the enriched pathways in acromegaly larvae. Y-axis, enriched pathway; X-axis, enrichment scores (ES). yellow highlighted bars represent a signaling pathway or biological themes related to ER stress, UPR, or protein folding. (B) Heatmap of ER stress markers in acromegaly model larvae versus control larvae (left). The results of gene set enrichment analysis showing the p values, false discovery rate (FDR), enrichment scores (ES), and normalized (ES) of ER stress markers (Supporting Information: Table S1) in the acromegaly model larvae (right). Significant p values < 0.05 and FDR q values < 0.25 are written in red. The reported p values of 0.0 indicates an actual p values of less than 0.01 (n = 3). ER, endoplasmic reticulum; UPR, unfolded protein response.
|
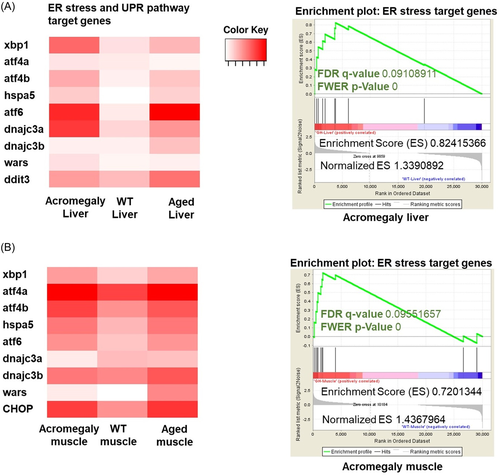
Induction of ER stress in acromegaly zebrafish liver and muscle. (A, B) Heatmap of ER stress markers of liver and muscle in WT, acromegaly model (1-year-old) and aged (3-year-old) (left). The results of the gene set enrichment analysis showing the p values, false discovery rate (FDR), enrichment scores (ES), and normalized ES of ER stress markers in acromegaly model liver and muscle versus WT (right). Significant p values < 0.05 and FDR q values < 0.25 are written in red. The reported p values of 0.0 indicates an actual p values of less than 0.01 (n = 3).
|

Induction of ER stress in acromegaly zebrafish brain and kidney. (A) Heatmap of ER stress markers of brain in WT, and acromegaly model (1-year-old). The results of the gene set enrichment analysis (GSEA) showing the p values, false discovery rate (FDR), enrichment scores (ES), and normalized ES of ER stress markers in acromegaly model brain and aged brain versus WT (lower). (B) Heatmap of ER stress markers of kidney in WT, acromegaly model (1-year-old) (left). The results of the GSEA showing the p values, FDR, enrichment scores (ES), and normalized ES of ER stress markers in acromegaly model kidney versus WT (right). Significant p < 0.05 and FDR q values < 0.25 are written in red (n = 3).
|
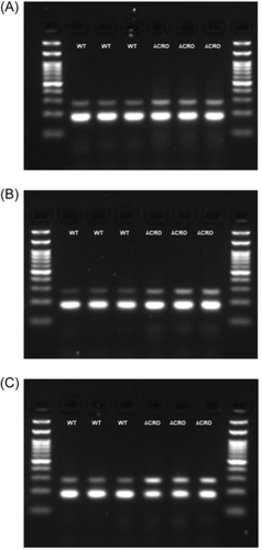
Detection of spliced xbp1 as a marker of endoplasmic reticulum (ER) stress in acromegaly larvae. Reverse transcription polymerase chain reaction showing expression of spliced and unspliced xbp1 gene in 1 dpf (A), 3 dpf (B), and 5 dpf (C) acromegaly and WT zebrafish larvae. |

Quantification of spliced xbp1 as a marker of endoplasmic reticulum (ER) stress acromegaly Larvae. Quantitative polymerase chain reaction showing relative expression of spliced xbp1 gene in WT and acromegaly zebrafish larvae at 1, 3, 5 dpf. Mean ± SE (n = 3). Statistical differences (t-test, p < 0.05) are denoted by asterisks. |

Quantification of spliced xbp1 as a marker of endoplasmic reticulum (ER) stress adult acromegaly model. quantitative polymerase chain reaction showing relative expression of spliced xbp1 gene in liver, muscle, brain, and kidney of WT and acromegaly zebrafish (1-year-old). Mean± SE (n = 3). Statistical differences (t-test, p < 0.05) are denoted by asterisks. |
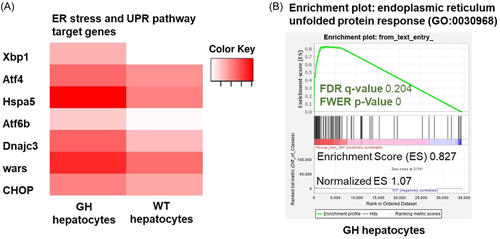
Induction of ER stress markers in GH-exposed mouse hepatocytes. (A) Heatmap of ER stress markers of GH-exposed mouse hepatocytes and WT cells. (B) The result of the gene set enrichment analysis showing the p values, false discovery rate (FDR), enrichment scores (ES), and normalized ES of endoplasmic reticulum unfolded protein response (GO:0030968) in GH-exposed mouse hepatocytes versus WT. Significant p < 0.05 and FDR q values < 0.25 are written in red. The reported p values of 0.0 indicates an actual p values of less than 0.01 (n = 3).
|