Image


                        Figure Caption


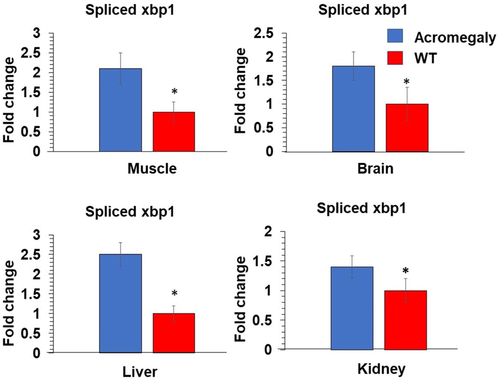
Fig. 6 Quantification of spliced xbp1 as a marker of endoplasmic reticulum (ER) stress adult acromegaly model. quantitative polymerase chain reaction showing relative expression of spliced xbp1 gene in liver, muscle, brain, and kidney of WT and acromegaly zebrafish (1-year-old). Mean± SE (n = 3). Statistical differences (t-test, p < 0.05) are denoted by asterisks.
                
                    
                        Figure Data


                        Acknowledgments


This image is the copyrighted work of the attributed author or publisher, and
ZFIN has permission only to display this image to its users.
Additional permissions should be obtained from the applicable author or publisher of the image.
      Full text @ J. Cell. Biochem.


        