
Image
|
Figure Caption
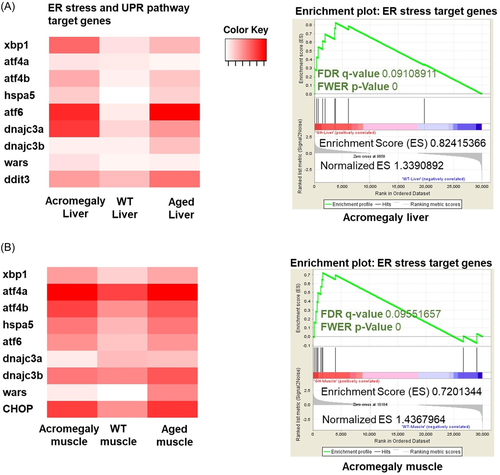
Fig. 2
Induction of ER stress in acromegaly zebrafish liver and muscle. (A, B) Heatmap of ER stress markers of liver and muscle in WT, acromegaly model (1-year-old) and aged (3-year-old) (left). The results of the gene set enrichment analysis showing the p values, false discovery rate (FDR), enrichment scores (ES), and normalized ES of ER stress markers in acromegaly model liver and muscle versus WT (right). Significant p values < 0.05 and FDR q values < 0.25 are written in red. The reported p values of 0.0 indicates an actual p values of less than 0.01 (n = 3).
Acknowledgments
This image is the copyrighted work of the attributed author or publisher, and
ZFIN has permission only to display this image to its users.
Additional permissions should be obtained from the applicable author or publisher of the image.
Full text @ J. Cell. Biochem.