
FIGURE
Fig. 1
- ID
- ZDB-FIG-220921-7
- Publication
- Elbialy et al., 2022 - Induction of endoplasmic reticulum stress markers in an acromegaly model
- Other Figures
- All Figure Page
- Back to All Figure Page
Fig. 1
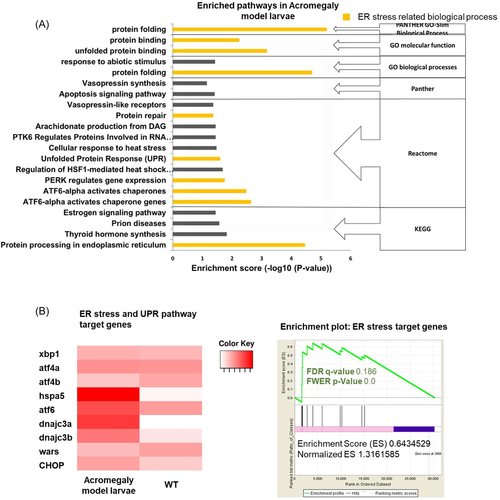
Induction of ER stress in acromegaly zebrafish larvae. (A) Histogram of all the enriched pathways in acromegaly larvae. Y-axis, enriched pathway; X-axis, enrichment scores (ES). yellow highlighted bars represent a signaling pathway or biological themes related to ER stress, UPR, or protein folding. (B) Heatmap of ER stress markers in acromegaly model larvae versus control larvae (left). The results of gene set enrichment analysis showing the p values, false discovery rate (FDR), enrichment scores (ES), and normalized (ES) of ER stress markers (Supporting Information: Table S1) in the acromegaly model larvae (right). Significant p values < 0.05 and FDR q values < 0.25 are written in red. The reported p values of 0.0 indicates an actual p values of less than 0.01 (n = 3). ER, endoplasmic reticulum; UPR, unfolded protein response.
|
Expression Data
Expression Detail
Antibody Labeling
Phenotype Data
Phenotype Detail
Acknowledgments
This image is the copyrighted work of the attributed author or publisher, and
ZFIN has permission only to display this image to its users.
Additional permissions should be obtained from the applicable author or publisher of the image.
Full text @ J. Cell. Biochem.