
- Title
-
Low Holding Densities Increase Stress Response and Aggression in Zebrafish
- Authors
- Andersson, M., Roques, J.A.C., Aliti, G.M., Ademar, K., Sundh, H., Sundell, K., Ericson, M., Kettunen, P.
- Source
- Full text @ Biology (Basel)
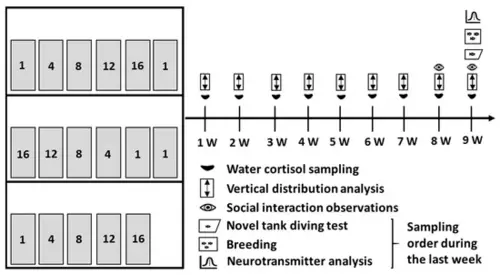
Figure 1. The experimental design. The left part of the figure illustrates the experimental set-up, and the right part of the figure illustrates the time frame of the experiment. For the set-up, each shelf held at least one tank from each density treatment. The densities were placed in increasing order from left to right on the top and bottom shelf, and from right to left on the middle shelf. |
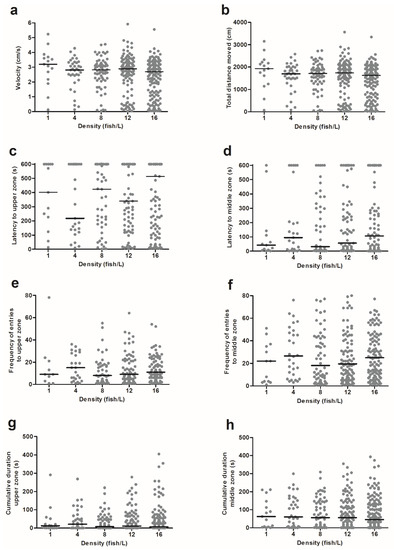
Figure 2. The behavioural responses in the novel tank diving test by zebrafish from holding densities of 1 (n = 15), 4 (n = 35), 8 (n = 65), 12 (n = 104), or 16 (n = 139) fish/L, respectively. Graphs show (a) velocity, (b) total distance moved, (c) latency to the upper zone, (d) latency to the middle zone, (e) frequency of entries to the upper zone, (f) frequency of entries to the middle zone, (g) cumulative duration in the upper zone, and (h) cumulative duration in the middle zone. Data points correspond to individual fish and medians are illustrated as lines. No statistically significant differences were found between the treatments. Each video analysis for the novel tank diving test lasted for 600 s. |
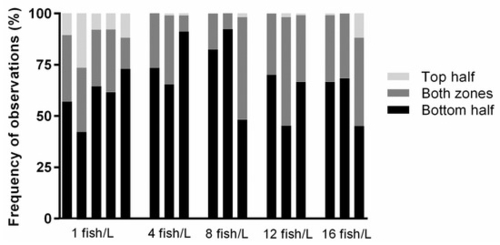
Figure 3. Vertical distribution for each tank holding densities of 1 (n = 5), 4 (n = 3), 8 (n = 3), 12 (n = 3), or 16 (n = 3) fish/L, respectively. There were three possible distribution zones: the bottom half of the tank, the top half of the tank, or both zones. The percentage frequency of observations was the number of observations during which 50% of the fish, or more, occupied one of these three zones. For each density treatment, there were three replicates and an additional two for the lowest density. Recorded videos of each tank were analysed twice a day for 30 s during the entire exposure period. |
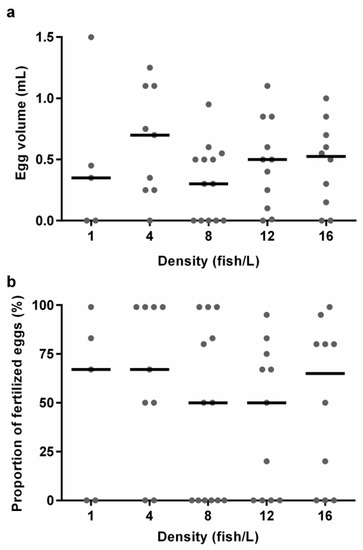
Figure 4. The results from the breeding experiments with zebrafish from holding densities of 1 (n = 5), 4 (n = 9), 8 (n = 13), 12 (n = 11), or 16 (n = 10) fish/L, respectively, from each breeding tank. Graphs show (a) egg volume and (b) proportion of fertilised eggs. Data points correspond to individual breeding tanks and medians are illustrated as lines. No statistically significant differences were found between the treatments. |
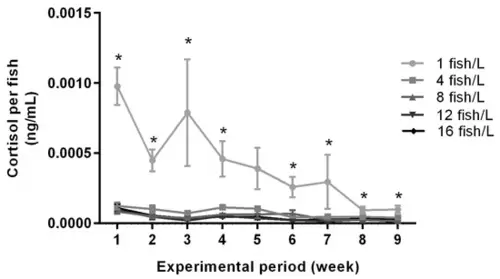
Figure 5. Water cortisol concentrations throughout the exposure period in tanks holding zebrafish at densities of 1 (n = 5), 4 (n = 3), 8 (n = 3), 12 (n = 3), or 16 (n = 3) fish/L, respectively. The graph shows cortisol levels per fish in each tank. Data are shown as mean ± standard error of the mean (SEM). Statistical significance between groups is presented as * p < 0.05. |
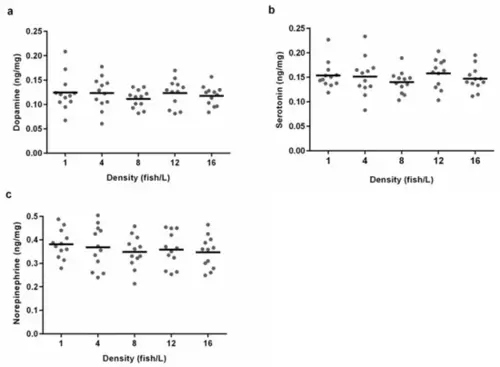
Figure 6. Whole-brain concentrations of monoamines for zebrafish from holding densities of 1 (n = 12), 4 (n = 12), 8 (n = 12), 12 (n = 12), or 16 (n = 12) fish/L, respectively. Graphs show individual concentrations of (a) dopamine, (b) serotonin and (c) norepinephrine. Means are illustrated as lines. No statistically significant differences were found between the treatments. |