
Image
|
Figure Caption
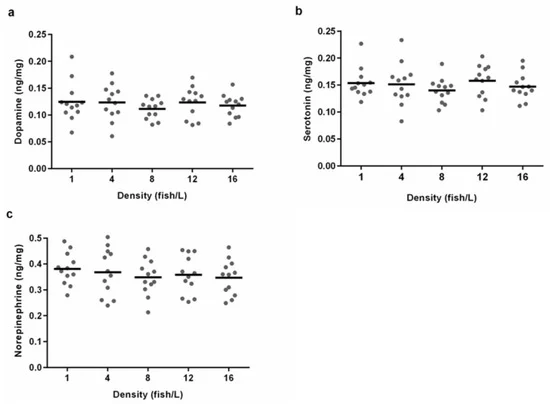
Fig. 6 Figure 6. Whole-brain concentrations of monoamines for zebrafish from holding densities of 1 (n = 12), 4 (n = 12), 8 (n = 12), 12 (n = 12), or 16 (n = 12) fish/L, respectively. Graphs show individual concentrations of (a) dopamine, (b) serotonin and (c) norepinephrine. Means are illustrated as lines. No statistically significant differences were found between the treatments.
Acknowledgments
This image is the copyrighted work of the attributed author or publisher, and
ZFIN has permission only to display this image to its users.
Additional permissions should be obtained from the applicable author or publisher of the image.
Full text @ Biology (Basel)