Image


                        Figure Caption


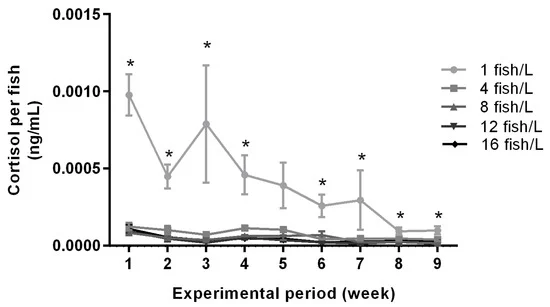
Fig. 5 Figure 5. Water cortisol concentrations throughout the exposure period in tanks holding zebrafish at densities of 1 (n = 5), 4 (n = 3), 8 (n = 3), 12 (n = 3), or 16 (n = 3) fish/L, respectively. The graph shows cortisol levels per fish in each tank. Data are shown as mean ± standard error of the mean (SEM). Statistical significance between groups is presented as * p < 0.05.
                
                    
                        Acknowledgments


This image is the copyrighted work of the attributed author or publisher, and
ZFIN has permission only to display this image to its users.
Additional permissions should be obtained from the applicable author or publisher of the image.
      Full text @ Biology (Basel)


        