
|
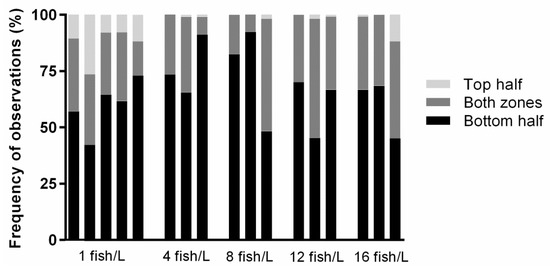
Fig. 3 Figure 3. Vertical distribution for each tank holding densities of 1 (n = 5), 4 (n = 3), 8 (n = 3), 12 (n = 3), or 16 (n = 3) fish/L, respectively. There were three possible distribution zones: the bottom half of the tank, the top half of the tank, or both zones. The percentage frequency of observations was the number of observations during which 50% of the fish, or more, occupied one of these three zones. For each density treatment, there were three replicates and an additional two for the lowest density. Recorded videos of each tank were analysed twice a day for 30 s during the entire exposure period.