
- Title
-
Orphan G-Protein Coupled Receptor GPRC5B Is Critical for Lymphatic Development
- Authors
- Xu, W., Nelson-Maney, N.P., Bálint, L., Kwon, H.B., Davis, R.B., Dy, D.C.M., Dunleavey, J.M., St Croix, B., Caron, K.M.
- Source
- Full text @ Int. J. Mol. Sci.
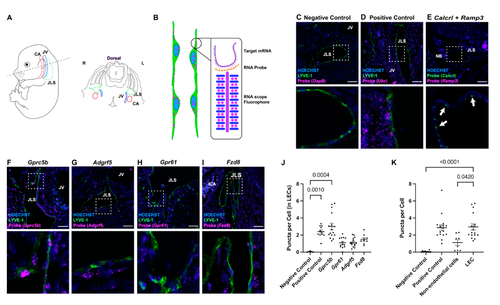
Figure 1. In situ localization of lymphatic endothelial cell-enriched GPCR expression. (A) Schematic diagram of E14.5 transverse section of mouse embryo depicting the sterotypic positioning of carotid artery (CA), jugular vein (JV) and jugular lymph sac (JLS). (B) Schematic diagram of RNAscope probe design, illustrating how a single mRNA molecule is amplified into a visible fluorophore puncta within a cell. (C–I) RNAscope images for indicated probes (magenta), Hoechst nulcei (blue) and the lymphatic maker LYVE-1 or Calcrl in panel (E) (green). Probe names are listed at top of images. Lower images are higher magnification views of the white dashed inset. White arrows in (E) point to lymphatic endothelial cells with double-labeling of the lymphatic GPCR, Calcrl (green) and Ramp3 (magenta). Scale bars = 50 µm. (J) RNAscope quantification for each orphan receptor probe in lymphatic endothelial cells and (K) RNAscope quantification for Gprc5b in various tissue types. Puncta per cell is a relative measure of the number of mRNA transcripts for the target gene. Non-endothelial cells (non-ECs) represent all background cells. LEC = lymphatic endothelial cells. Significance calculated using Kruskal–Wallis nonparametric analysis of variance with Dunn’s multiple comparisons test. p-values equal to or less than 0.05 are shown.
|
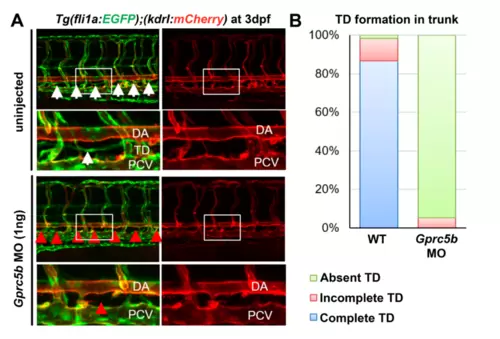
Figure 2. Zebrafish gprc5b morphant embryos exhibit decreased lymphatic vessel formation. (A) Confocal images of Tg(fli1a: EGFP); Tg(kdrl: Hsa.HRASmCherry) control (uninjected) and 1 ng of gprc5ba morpholino-injected larvae at 72 h post-fertilization (hpf). The boxes in the above panels are enlarged in the bottom panels, respectively. White arrows point to EGFP-positive TD in the trunk region. Red arrows point to defects in TD formation in the trunk region. Anterior to the left, dorsal to the top. DA, dorsal aorta; PCV, posterior cardinal vein; TD, thoracic duct. (B) Quantification of EGFP-positive/kdrl-negative thoracic duct in the trunk (six somites). Uninjected embryos (N = 10) and gprc5ba MO-injected larvae (N = 13), from three independent clutches.
EXPRESSION / LABELING:
PHENOTYPE:
|
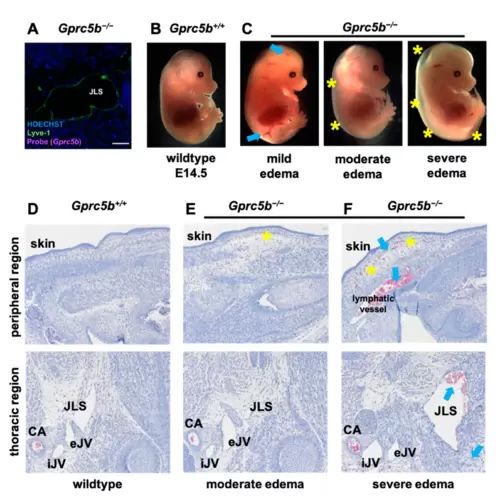
Figure 3. Lymphatic development is attenuated in murine Gprc5b−/− embryos. (A) RNAscope performed on jugular section of Gprc5b−/− embryo, confirming absence of mRNA expression (compare to Figure 1F): Gprc5b probe (magenta), LYVE-1 lymphatic marker (green), Hoechst cell nuclei (blue). (B) E14.5 Gprc5b+/+ littermate control embryo. (C) E14.5 Gprc5b−/− embryos show graded levels of edema (yellow asterisks) and hemorrhagic plaques (blue arrows). Compared to normal Gprc5b+/+ littermate controls (D), representative H&E images showing subcutaneous edema in the back skin (upper panels, yellow asterisks) and blood-filled lymphatic vessels (lower panels, blue arrows) in Gprc5b−/− embryos with moderate to severe edema (E,F). CA, carotid artery; iJV, internal jugular vein; eJV, external jugular vein, JLS, jugular lymph sac.
|
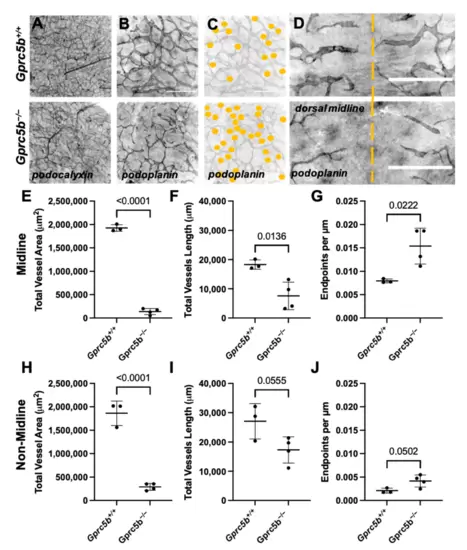
Figure 4. Histomorphometric analysis of vascular development reveals attenuated lymphangiogenesis in murine Gprc5b−/− embryos. Whole-mount immunostaining of dorsal skin from E14.5 Gprc5b+/+ (top panels (A–D)) and Gprc5b−/− (bottom panels (A–D)) embryos, stained for the blood vascular marker podocalyxin (A) and the lymphatic marker podoplanin (B–D). Yellow dashed line indicates the dorsal midline (D). Scale bars = 500 µm (E–J). Quantification of total vessel area, total vessel length and relative endpoint counts of lymphatic vessels present at the dorsal back skin midline (E–G) and in the dorsal backskin in non-midline locations (H–J). Significance calculated using unpaired Student’s t-tests.
|
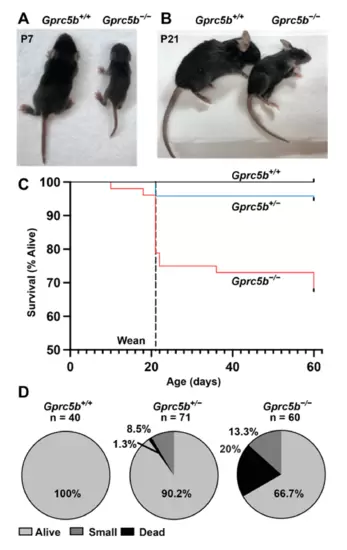
Figure 5. Gprc5b−/− mice die postnatally and exhibit growth restriction. (A,B) Representative images of Gprc5b+/+ (left) and Gprc5b−/− (right) mice at postnatal days 7 (A) and 21 (B), showing marked growth restriction in Gprc5b−/− mice. (C) Survival curve shows ~25% loss of Gprc5b−/− mice prior to weaning. (D) Quantitation of growth restriction and death phenotypes by genotype from heterozygous Gprc5b+/− intercrosses.
|
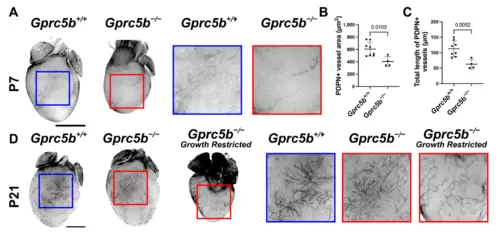
Figure 6. Attenuated postnatal cardiac lymphangiogenesis in developing and growth-restricted Gprc5b−/− mice. (A) Whole-mount immunostaining of podoplanin (PDPN)-positive cardiac lymphatics of P7 Gprc5b+/+ hearts (left) and Gprc5b−/− hearts (right). (B) Quantification of PDPN-positive vessel area of dorsal or ventral surface of the heart. (C) Quantification of total PDPN-positive vessel length of dorsal or ventral surface of the heart. Significance calculated using unpaired t-test. (D) Whole-mount immunostaining of podoplanin-positive cardiac lymphatics of P21 Gprc5b+/+ hearts (left), non-growth-restricted (middle) and growth-restricted (right) Gprc5b−/− hearts. High magnification of insets provided to the right of full heart images. Blue border = Gprc5b+/+, red border = Gprc5b−/−. Scale bar = 2 mm.
|
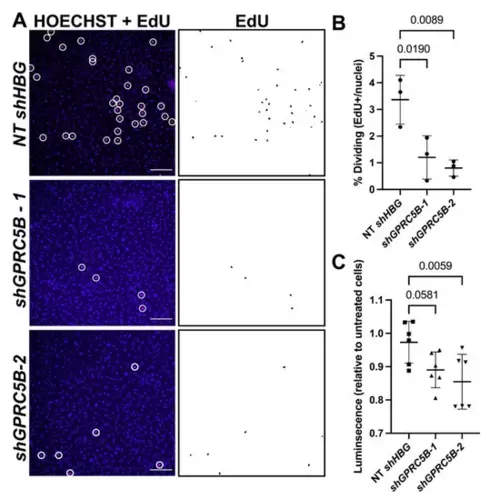
Figure 7. hGPRC5B-deficient human lymphatic endothelial cells are less proliferative and less viable compared to control cells. (A) Immunofluorescence of human dermal lymphatic endothelial cells treated in vitro with non-targeting control shRNA or shRNA targeting GPRC5B. Left column: red puncta encircled in white indicate Edu-positive cells. Right column: monostaining of EdU-positive nuclei. (B) Quantification of EdU-positive lymphatic endothelial cells. (C) CellTiter-Glo cell viability assay where luminescence indicates viable cells. Significance calculated using one-way ANOVA with correction for multiple comparisons. Scale bar = 50 µm.
|