
- Title
-
Pacsin2 is required for endocytosis in the zebrafish pronephric tubule
- Authors
- Morgan, J., Yarwood, R., Starborg, T., Yan, G., Lowe, M.
- Source
- Full text @ Biol. Open
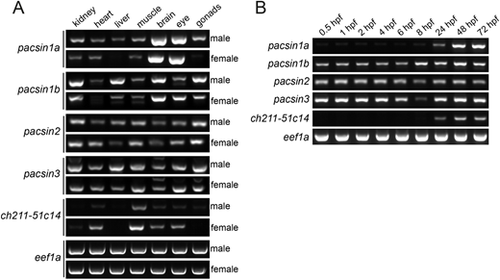
Tissue and developmental expression of zebrafish pacsin genes. (A) The expression of pacsin1a, pacsin1b, pacsin2, pacsin3, and ch211-51c14-1 mRNA was analysed by RT-PCR in whole organs of male (top panels) and female (bottom panels) adult zebrafish. The housekeeping gene eef1a was used as a positive control. (B) Developmental expression profile of the indicated pacsin genes at different developmental timepoints was assessed by RT-PCR. eef1a was used as a loading control. |
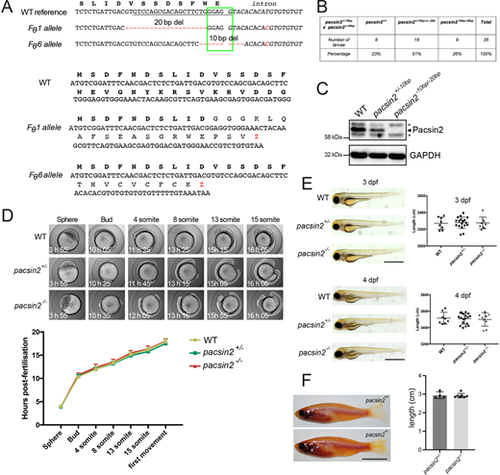
Generation and normal development of pacsin2 knockout zebrafish. (A) Top, mutant pacsin2 alleles in F0 founder zebrafish (Fθ) aligned to a wild-type reference sequence. Red dashes indicate deleted nucleotides. Red nucleotides indicate an SNP present in the intronic sequence. The green box indicates a splice donor site at the end of exon 2. The underlined sequence is the guide RNA target sequence. Bottom, predicted protein sequences encoded by the two indicated pacsin2 mutant alleles. (B) Larvae produced by crossing pacsin2+/−10bp and pacsin2+/−20bp zebrafish are at the expected Mendelian ratio. (C) Western blot analysis of whole-brain protein lysates from wild-type, pacsin2+/−10bp and pacsin2−10bp/−20bp adult fish blotted for Pacsin2 (arrow indicates Pacsin2 band, asterisks indicate cross-reacting proteins) and GAPDH. (D) Wild-type, pacsin2+/− and pacsin2−/− embryos were imaged every 10 min over the first 20 h post-fertilisation and developmental progression scored. Data were analysed using two-way ANOVA and Dunnett's multiple comparison test. In all cases P>0.05, n=7-10 embryos per genotype. Error bars=s.d. (E) Zebrafish larvae at 3 and 4-dpf were imaged on a brightfield dissecting microscope and assessed for gross morphology (left). Body length was also measured (right). Data were analysed by one-way ANOVA followed by a post-hoc Tukey's multiple comparison test. In all cases P>0.05. n=8-18 larvae per genotype. Error bars=s.d.; scale bar: 1 mm. (F) Left, 5-month-old adult male pacsin2+/− and pacsin2−/− clutch-mates were photographed and inspected for gross morphology (left). Right, body axis length was measured and analysed using an unpaired t-test, P>0.05. n=4 (pacsin2+/−) and 7 (pacsin2−/−). Error bars=s.d.; scale bar: 1 cm. |

Depletion or knockout of Pacsin2 in zebrafish larvae impairs renal tubule endocytosis. (A) Schematic representation of dextran reabsorption assay performed on zebrafish larvae. (B) Top, representative image of 4 dpf pacsin2+/− (left) and pacsin2−/− (right) larvae 1.5 h post-injection with 10 kDa dextran-A488, displaying normal and no uptake phenotypes, respectively. Scale bar: 25 µm. The blue dashed line indicates the position of the proximal tubule. Bottom, the percentage of larvae showing normal, low or no uptake phenotypes in pacsin 2+/− and pacsin 2−/− larvae. Data were analysed using a Chi-squared test. **P<0.01. n=67 (pacsin2+/−) and 41 (pacsin2−/−). (C) Top, representative images of 3 dpf control larvae showing normal accumulation of 10 kDa dextran-A488 at 1.5 h post-injection and morphant embryos displaying low or no uptake phenotypes, respectively. The blue dashed lines outline the position of the proximal tubule. Scale bar: 50 µm. Bottom, quantification of uptake phenotypes of control, E2MO and E4MO morphant larvae. Data were analysed using a Chi-squared test. **P<0.01, ***P<0.001, ****P<0.0001. n=28-84 larvae per genotype. (D) Top, representative images of cmlc:GFP (top row, mock) and enpep:pacsin2 (bottom row) rescued pacsin2+/− and pacsin2−/− larvae. The blue dashed lines outline the proximal tubule. Scale bar: 60 µm. Bottom, percentage of total larvae scored for uptake phenotypes. Data were analysed using a Chi-squared test. **P<0.01. n=23-56 larvae per genotype. PHENOTYPE:
|

Loss of Pacsin2 causes reduced abundance of megalin and endocytic markers in the proximal tubule. (A) Top, transverse cryosections of proximal tubule were immunolabeled for Pacsin2, Rab11 and megalin in 3 dpf wild-type larvae. Insets depict an enlarged view of the boxed region, rotated 90˚ clockwise. Blue arrows indicate regions of colocalisation between Pacsin2, Rab11 and megalin. Bottom, 3 dpf pacsin2 E2MO morphant larvae labelled with anti-Pacsin2 antibody. (B) Top, transverse cryosections through the pronephros of 3 dpf control morphant or pacsin2 E2MO morphant larvae immunolabeled for megalin, EEA1 and Rab11. Bottom, quantification of relative signal intensity of megalin, EEA1 and Rab11, respectively, between control and pacsin2 morphants. n=5-12 for control morphants and 6-14 for pacsin2 morphants. Unpaired t-test, * P<0.05, ** P<0.01, **** P<0.0001. Error bars=s.d. (C) Left, transverse sections through the proximal tubule of 4 dpf pacsin2+/− or pacsin2−/− larvae immunolabelled for megalin and Rab11. Right, quantification of relative signal intensity of megalin and Rab11, respectively, between pacsin2+/− and pacsin2−/− larvae. n=11 and 13 for megalin, and 9 and 13 for Rab11 for pacsin2+/− and pacsin2−/−, respectively. Unpaired t-test, *P<0.05 *** P<0.001. Error bars=s.d. Dashed white lines indicate the outer margin of the pronephros. Scale bars: 10 µm. EXPRESSION / LABELING:
PHENOTYPE:
|
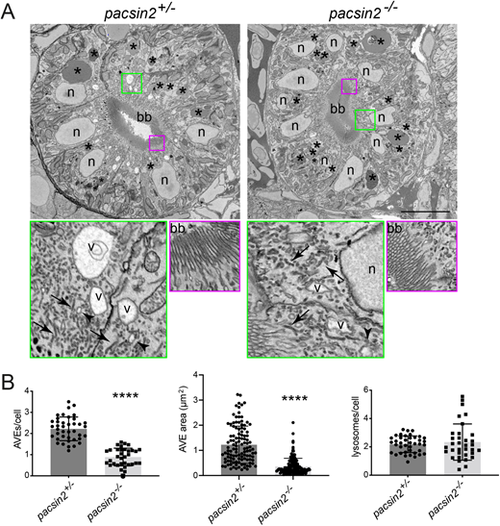
Loss of Pacsin2 results in reduced abundance of the apical endocytic organelles in the proximal tubule. (A) Block-face SEM images of transverse proximal tubule sections from pacsin2+/− (left panels) and pacsin2−/− (right panels) 4 dpf larvae. Top panels show whole cross-section of the proximal tubule, bottom panels show enlarged boxed regions indicated in green and red. Top panels: scale bar: 10 µm. Green and red boxed areas=4 µm and 3 µm, respectively. bb, brush border; V, apical vacuolar endosome; N, nucleus; *, lysosomes; arrows, dense apical recycling tubules; arrowheads, endocytic vesicles. (B,C) Average number and size of AVEs, respectively, and (D) number of lysosomes per cell. Unpaired t-test, **** P<0.0001. For B and D, n=40 (pacsin2+/−) and 34 (pacsin2−/−). For C, n=114 (pacsin2+/−) and 136 (pacsin2−/−). Error bars=s.d. PHENOTYPE:
|