
Fig. 3
- ID
- ZDB-IMAGE-220629-3
- Publication
- Morgan et al., 2022 - Pacsin2 is required for endocytosis in the zebrafish pronephric tubule
- All Figures
- Figures for Morgan et al., 2022
|
Fig. 3
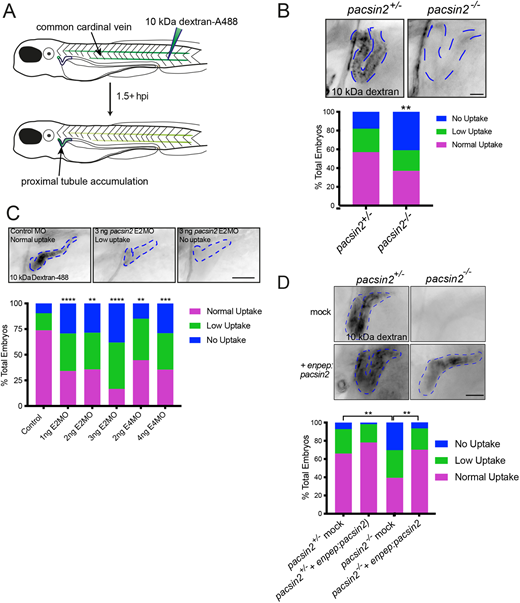
Depletion or knockout of Pacsin2 in zebrafish larvae impairs renal tubule endocytosis. (A) Schematic representation of dextran reabsorption assay performed on zebrafish larvae. (B) Top, representative image of 4 dpf pacsin2+/− (left) and pacsin2−/− (right) larvae 1.5 h post-injection with 10 kDa dextran-A488, displaying normal and no uptake phenotypes, respectively. Scale bar: 25 µm. The blue dashed line indicates the position of the proximal tubule. Bottom, the percentage of larvae showing normal, low or no uptake phenotypes in pacsin 2+/− and pacsin 2−/− larvae. Data were analysed using a Chi-squared test. **P<0.01. n=67 (pacsin2+/−) and 41 (pacsin2−/−). (C) Top, representative images of 3 dpf control larvae showing normal accumulation of 10 kDa dextran-A488 at 1.5 h post-injection and morphant embryos displaying low or no uptake phenotypes, respectively. The blue dashed lines outline the position of the proximal tubule. Scale bar: 50 µm. Bottom, quantification of uptake phenotypes of control, E2MO and E4MO morphant larvae. Data were analysed using a Chi-squared test. **P<0.01, ***P<0.001, ****P<0.0001. n=28-84 larvae per genotype. (D) Top, representative images of cmlc:GFP (top row, mock) and enpep:pacsin2 (bottom row) rescued pacsin2+/− and pacsin2−/− larvae. The blue dashed lines outline the proximal tubule. Scale bar: 60 µm. Bottom, percentage of total larvae scored for uptake phenotypes. Data were analysed using a Chi-squared test. **P<0.01. n=23-56 larvae per genotype.