
- Title
-
Genome-wide association study reveals the genetic basis of growth trait in yellow catfish with sexual size dimorphism
- Authors
- Huang, P., Guo, W., Wang, Y., Xiong, Y., Ge, S., Gong, G., Lin, Q., Xu, Z., Gui, J.F., Mei, J.
- Source
- Full text @ Genomics

The distribution and correlation analysis of phenotypic data in female yellow catfish. Normal distribution of body length (A) and body weight (B) of the test female yellow catfish at 6-month-old. (C) Simple linear regression analysis of the relation between body length and body weight. (For interpretation of the references to colour in this figure legend, the reader is referred to the web version of this article.) |

GWASanalysis for body length in female yellow catfish. (A) Manhattan plot of GWAS for body length generated from MLM. The red solid line indicates the threshold level (−log10(3.97E−8)) for genome-wide significance. The blue solid line indicates the threshold level (−log10(7.94E−7)) for significance of suggestive association. (B) Quantile-Quantile (Q-Q) plot of the GWAS for body length. (C) Genes within ±0.5 Mb of the significant locus Chr15:19195072 that is associated with body length. The red vertical line indicates the associated locus. The red horizontal line indicates the threshold P value for genome-wide significance. The blue horizontal line indicates the threshold P value for significance of suggestive association. Growth-related genes are highlighted in red. (D) Schematic diagram of genomic DNA information and candidate SNP in stat5b gene of yellow catfish. (E) Statistical comparison between body length and three genotypes of the SNP Chr15:19195072 (G/C). (For interpretation of the references to colour in this figure legend, the reader is referred to the web version of this article.) |
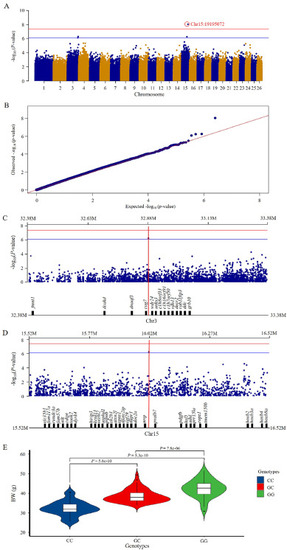
GWAS analysis for body weight in female yellow catfish. (A) Manhattan plot of genome-wide association analysis for body weight generated from MLM. The red solid line indicates the threshold level (−log10(3.97E-8)) for genome-wide significance. The blue solid line indicates the threshold level (−log10(7.94E-7)) for significance of suggestive association. (B) Quantile-Quantile (Q-Q) plot of the GWAS for body weight. (C |
 D) Genes within ±0.5 Mb of the suggestive loci associated with body weight on Chr3 and Chr15. The red vertical line indicates the associated locus. The red horizontal line indicates the threshold P value for genome-wide significance. The blue horizontal line indicates the threshold P

Statistical comparison between grow traits and three genotypes of the SNP Chr15:19195072 (G/C) in male yellow catfish. (For interpretation of the references to colour in this figure legend, the reader is referred to the web version of this article.) |
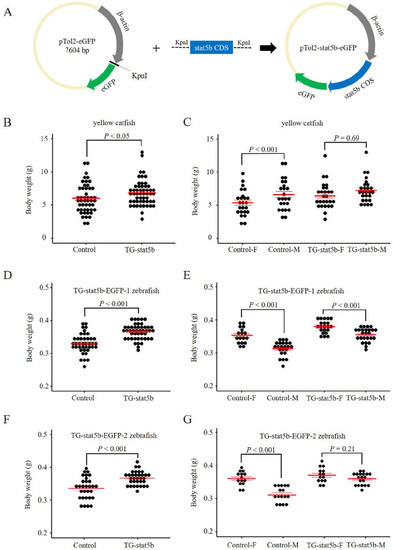
Growth performance in the control and stat5b transgenic yellow catfish and zebrafish. (A) The construction of transgenic plasmid pTol2-β-actin-stat5b-EGFP. Yellow catfish stat5b gene was inserted into the transgenic plasmid, and pTol2-β-actin- EGFP was used as the control. (B) Comparisons of the body weight in the control and stat5b transgenic yellow catfish at 4-month-old. F0 generation was used. (C) Evaluation of the sexual dimorphism in body weight of the control and stat5b transgenic yellow catfish at 4-month-old. F0 generation was used. (D, F) Comparisons of the body weight in the control and two stat5b heterozygous transgenic zebrafish lines (TG-stat5b-EGFP-1 and TG-stat5b-EGFP-2) at 4-month-old. (E and G) Evaluation of the sexual dimorphism in body weight of the control and two stat5b heterozygous transgenic zebrafish lines (TG-stat5b-EGFP-1 and TG-stat5b-EGFP-2) at 4-month-old. (For interpretation of the references to colour in this figure legend, the reader is referred to the web version of this article.) |